Introduction
Enterprises today are not bound to a single cloud. Applications run across AWS, Azure, and GCP simultaneously—a customer-facing app on AWS, internal data pipelines on Azure, and analytics workloads on GCP. While this provides resilience and flexibility, it introduces one of the toughest engineering challenges: monitoring and observability across multiple clouds.
Imagine an e-commerce platform where the checkout API is hosted on AWS, inventory is updated from Azure SQL, and recommendation engines are powered by GCP BigQuery. If latency spikes or an error occurs, engineers need end-to-end visibility across clouds.
This is where monitoring + observability come in. At Curiosity Tech, we often guide engineers step-by-step on building unified dashboards and implementing best practices for cross-cloud monitoring.
Step 1 – Understanding the Difference
In multi-cloud setups, Monitoring checks if systems are “alive” , but Observability ensures engineers can diagnose why something is wrong across distributed services.
Step 2 – Native Monitoring Tools Across Clouds
Each cloud has its own tools:
| Cloud | Native Monitoring Tool | Observability Features |
|---|---|---|
| AWS | CloudWatch + X-Ray | Metrics, Logs, Traces, Alarms |
| Azure | Azure Monitor + App Insights | Metrics, Application Maps, Alerts |
| GCP | Cloud Monitoring (Stackdriver) | Logs Explorer, Metrics, Trace, Uptime Checks |
Key Challenge: These tools don’t “talk” to each other by default. Engineers need to integrate them using third-party platforms or custom pipelines.
Step 3 – Setting Up a Multi-Cloud Monitoring Pipeline (Tutorial)
Hands-On Guide:
- Export Metrics:
- AWS → CloudWatch → Amazon Kinesis Data Firehose
- Azure → Metrics → Event Hub
- GCP → Export to Pub/Sub
- Ingest into a Central Platform:
- Use tools like Prometheus, Datadog, or Elastic Stack (ELK)
- Stream all data into one central system
- Standardize Logs:
- Use Fluentd or Logstash to clean and unify log formats
- Example: AWS EC2 logs ≠ Azure VM logs → standardization is key
- Visualize with Dashboards:
- Use Grafana or Datadog to create dashboards
- Show metrics like:
- “Checkout API latency” (AWS)
- “DB response time” (Azure)
- “Analytics query runtime” (GCP)
- Set Alerts & Automation:
- Threshold-based alerts: e.g., 500 errors > 10/min
- AI-based alerts: detect sudden spikes in latency
- Auto-remediation: use AWS Lambda, Azure Functions, or GCP Cloud Functions
Step 4 – Best Practices for Multi-Cloud Observability
- Correlate Metrics, Logs, and Traces
- Example: If Azure DB latency spikes, link it with AWS API error logs
- Use Open Standards (like OpenTelemetry)
- Instrument your services once, and collect data across all clouds
- Define SLIs, SLOs, and SLAs
- SLIs: Service Level Indicators (e.g., latency, error rate)
- SLOs: Targets like 99.9% uptime
- SLAs: Formal agreements with cloud providers
- Use Distributed Tracing
- Tools: Jaeger, Zipkin, or Datadog APM
- Track one user request across AWS → Azure → GCP
- Secure Your Monitoring
- Logs may contain sensitive data (like PII) → mask or redact before exporting
- Always encrypt logs at rest and in transit
Step 5 – Example Project
At CuriosityTech.in labs, learners build a real multi-cloud monitoring setup:
- Deploy a sample app:
- Frontend on AWS
- Backend API on Azure
- Analytics service on GCP
- Add OpenTelemetry SDK to each service
- Collect metrics in Prometheus
- Visualize data in Grafana
- Trigger alerts in Slack or Teams when error rates cross thresholds
This hands-on project helps engineers connect theory with real-world practice.
Diagram (Best Practices Infographic)
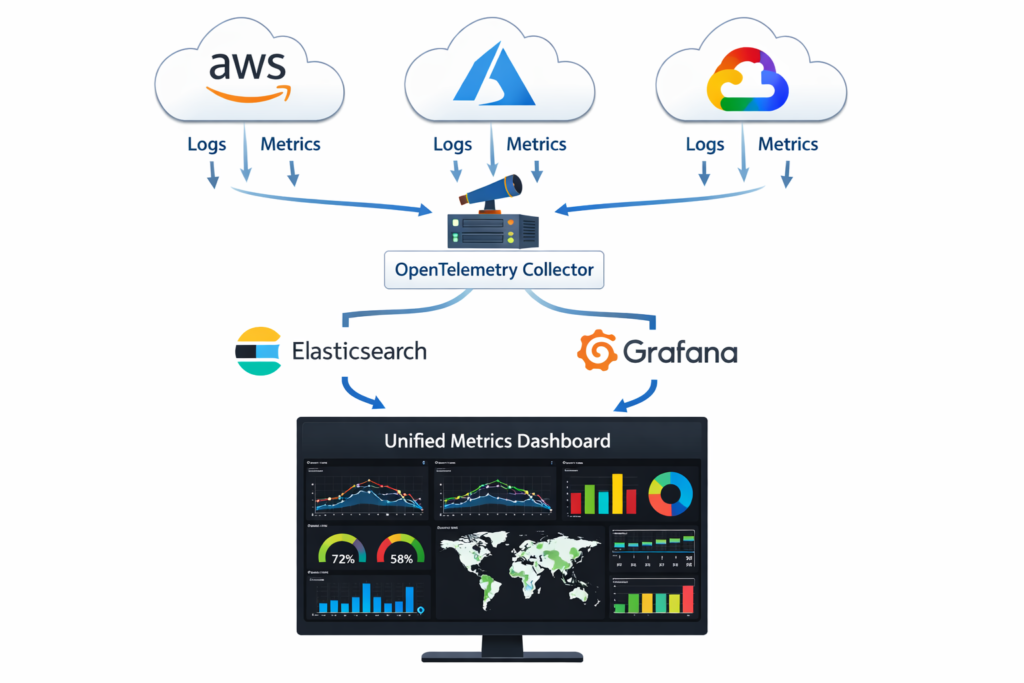
A diagram would show:
- Three clouds (AWS, Azure, GCP).
- Each cloud’s logs + metrics flowing into a central OpenTelemetry collector.
- From collector → Elasticsearch + Grafana.
- Grafana dashboard showing unified metrics
Challenges in Real-World Multi-Cloud Monitoring:
- Latency in Data Collection – Real-time visibility is harder across clouds
- Vendor Lock-In – Cloud-native tools work best only inside their cloud
- Data Egress Costs – Exporting logs across clouds can be expensive
- Skill Gap – Engineers may know CloudWatch well but not Azure Monitor or GCP Logging
Conclusion
Monitoring in multi-cloud is not about simply “checking CPU usage.” It is about creating a narrative of system health across distributed providers. Enterprises that rely only on cloud-native monitoring miss the bigger picture. True observability demands open standards, centralized pipelines, and proactive alerting.
As we teach at Curiosity Tech, the future cloud engineer must build observability into design, not bolt it on later. By mastering cross-cloud monitoring tools, open standards like OpenTelemetry, and centralized visualization, you don’t just react to failures—you anticipate and prevent them.