Introduction
While supervised learning deals with labeled data, the real world is full of unlabeled, complex datasets. In 2025, unsupervised learning has become critical for uncovering hidden patterns in data that are not immediately obvious.
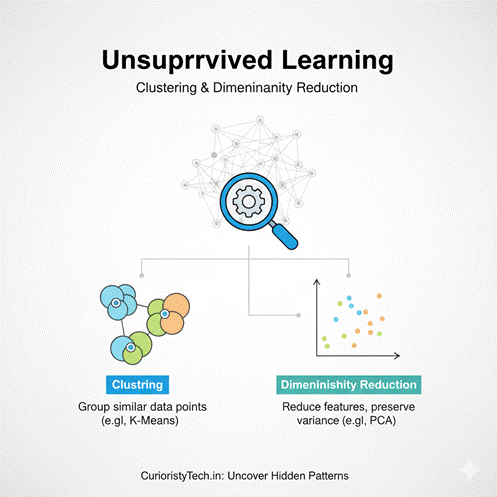
At CuriosityTech.in (Nagpur, Wardha Road, Gajanan Nagar), we guide students to understand clustering and dimensionality reduction—the backbone of exploratory data analysis, anomaly detection, and recommendation systems.
Unsupervised learning is like exploring an unknown city: you don’t have a map, but by observing patterns, neighborhoods, and clusters, you can make sense of it.
1. What is Unsupervised Learning?
Definition: A machine learning technique that works with unlabeled data to discover inherent structures or patterns.
Applications in 2025:
- Customer segmentation in marketing
- Detecting anomalies in banking transactions
- Image compression in computer vision
- Feature reduction for faster ML pipelines
CuriosityTech Insight: Beginners often think unsupervised learning is harder, but with visualization and iterative analysis, patterns become intuitive.
2. Types of Unsupervised Learning
Two major categories:
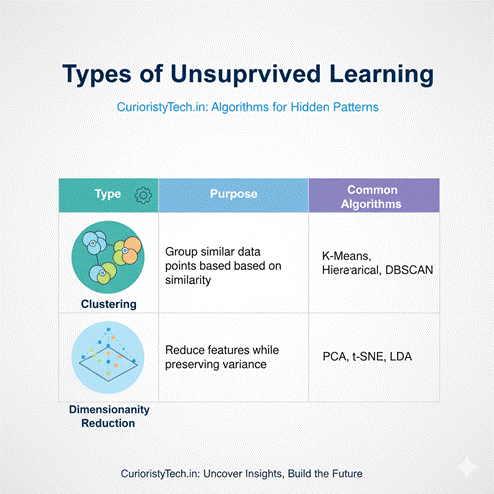
| Type | Purpose | Common Algorithms | Example |
| Clustering | Group similar data points | K-Means, Hierarchical, DBSCAN | Customer segmentation |
| Dimensionality Reduction | Reduce features while preserving variance | PCA, t-SNE, LDA | Image compression, feature reduction |
3. Clustering Explained
Definition: Clustering partitions data into groups (clusters) based on similarity or distance.
Scenario Storytelling:
Riya, a student at CuriosityTech Park, wants to segment e-commerce customers for personalized offers. Using K-Means clustering, she finds:
- Cluster 1 → Frequent buyers with high spending
- Cluster 2 → Occasional buyers
- Cluster 3 → New customers
This allows the marketing team to target campaigns effectively.
K-Means Process (Diagram Description):
- Initialize k centroids randomly
- Assign each data point to the nearest centroid
- Update centroids based on cluster members
- Repeat until convergence
Python Snippet:
from sklearn.cluster import KMeans
import pandas as pd
df = pd.read_csv(“customer_data.csv”)
X = df[[‘annual_income’,’spending_score’]]
kmeans = KMeans(n_clusters=3, random_state=42)
df[‘cluster’] = kmeans.fit_predict(X)
Visualization Tip: Plot clusters using Matplotlib with different colors for each cluster—students at CuriosityTech.in find this step crucial for understanding patterns.
4. Dimensionality Reduction Explained
High-dimensional data can be complex and redundant. Dimensionality reduction simplifies data while preserving essential information.
Techniques:
- PCA (Principal Component Analysis): Converts correlated features into independent components
- t-SNE (t-Distributed Stochastic Neighbor Embedding): Reduces dimensions for visualization
- LDA (Linear Discriminant Analysis): Supervised technique but often paired for feature reduction
Scenario Storytelling:
Arjun, an ML engineer student, works with image data (1000 features per image). Using PCA, he reduces features to 50 principal components while retaining 95% variance. This drastically reduces training time for downstream ML models.
Python Snippet:
from sklearn.decomposition import PCA
pca = PCA(n_components=2)
X_reduced = pca.fit_transform(X)
Visualization Tip: Plot X_reduced using a scatter plot to see clusters in 2D. CuriosityTech students learn that even complex datasets become interpretable with dimensionality reduction.
5. Combined Flowchart: Clustering & Dimensionality Reduction
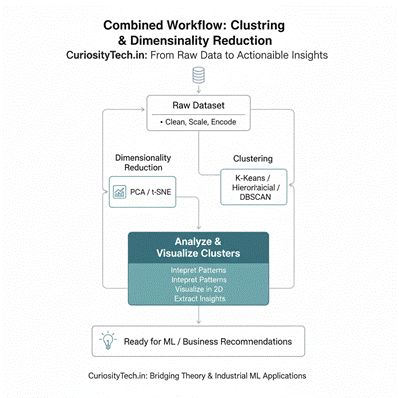
Raw Dataset
│
├─> Preprocessing (clean, scale, encode)
│
├─> Dimensionality Reduction (PCA/t-SNE)
│
└─> Clustering (K-Means / Hierarchical / DBSCAN)
├─ Analyze clusters
└─ Visualize for insights
At CuriosityTech.in, learners practice pipelines like this on real-world datasets, bridging the gap between theory and industrial ML applications.
6. Mini Project Example: E-Commerce Customer Segmentation
Problem: Segment 5000 customers for targeted marketing campaigns.
Steps at CuriosityTech Labs:
- Load and clean data → Handle missing values, normalize numeric columns
- Feature Selection & Scaling → StandardScaler
- Dimensionality Reduction → Reduce 10 features to 2 for visualization
- Clustering → K-Means with optimal k determined using Elbow Method
- Analyze clusters → Interpret spending patterns, loyalty, and demographics
Python Snippet:
from sklearn.preprocessing import StandardScaler
scaler = StandardScaler()
X_scaled = scaler.fit_transform(df[[‘annual_income’,’spending_score’]])
from sklearn.decomposition import PCA
pca = PCA(n_components=2)
X_pca = pca.fit_transform(X_scaled)
from sklearn.cluster import KMeans
kmeans = KMeans(n_clusters=3, random_state=42)
clusters = kmeans.fit_predict(X_pca)
df[‘cluster’] = clusters
Visualization: Scatter plot with three clusters and centroid markers.
7. Practical Tips from CuriosityTech Experts
- Always scale features before clustering.
- Use Elbow Method or Silhouette Score to determine optimal clusters.
- Dimensionality reduction helps visualize high-dimensional datasets.
- Combine both techniques for better insight extraction.
Students at CuriosityTech Nagpur often work with datasets like banking, retail, and IoT, ensuring unsupervised learning is industry-ready.
8. Real-World Applications
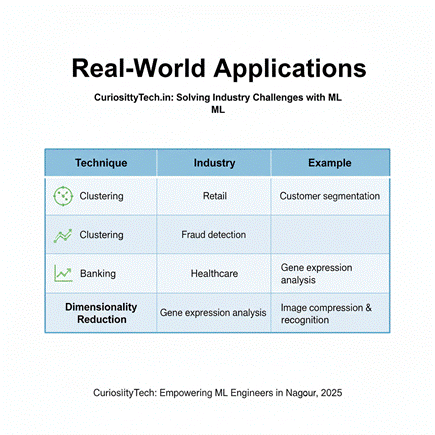
| Technique | Industry | Example |
| Clustering | Retail | Customer segmentation |
| Clustering | Banking | Fraud detection |
| Dimensionality Reduction | Healthcare | Gene expression analysis |
| Dimensionality Reduction | Computer Vision | Image compression & recognition |
9. Key Takeaways
- Unsupervised learning is crucial for exploring unlabeled data.
- Clustering identifies patterns and segments naturally.
- Dimensionality reduction simplifies data and improves ML performance.
- Hands-on projects and visualization make learning intuitive.
As we tell learners at CuriosityTech.in: “If supervised learning is reading a map, unsupervised learning is discovering hidden cities and roads.”
Conclusion
Clustering and dimensionality reduction are essential skills for ML engineers in 2025. Mastery allows you to:
- Extract patterns from complex datasets
- Reduce model training times
- Visualize high-dimensional data intuitively
- Prepare pipelines for real-world applications
CuriosityTech Nagpur provides mentorship, practice datasets, and guided projects to ensure students gain both conceptual clarity and practical expertise. Contact contact@curiositytech.in or +91-9860555369 to start learning today.

