

Introduction (Stepwise Investigation Style)
Exploratory Data Analysis (EDA) is the first critical step in any data analysis workflow. It allows analysts to understand the dataset, detect patterns, identify anomalies, and uncover relationships before diving into modeling or reporting.
Imagine a retail company in Nagpur launching a new product line. You have transaction data spanning months. You need to answer questions such as:
- Which products are driving sales?
- Are there regional differences?
- Are there missing values or outliers affecting insights?
EDA helps answer these questions systematically, ensuring data-driven decisions. At CuriosityTech.in, we guide learners to conduct EDA step-by-step, using real-world datasets to mimic corporate scenarios.
Step 1: Import Libraries & Dataset
import pandas as pd
import numpy as np
import matplotlib.pyplot as plt
import seaborn as sns
data = pd.read_csv(“retail_sales_nagpur.csv”)
Purpose: Load data and set up the environment for analysis.
Step 2: Initial Inspection
- Check first rows: data.head()
- Check dataset shape: data.shape
- Data types: data.info()
- Summary statistics: data.describe()
Goal: Understand the dataset structure, column types, and numeric summaries.
Step 3: Handling Missing Values
- Check missing values: data.isnull().sum()
- Fill missing numeric values with mean/median
- Fill missing categorical values with mode
- Drop columns with too many missing values
Tip: Proper handling of missing values is crucial for accurate insights.
Step 4: Detecting Outliers
- Use boxplots to detect extreme values:
sns.boxplot(x=’Revenue’, data=data)
plt.show()
- Calculate IQR for numeric columns to identify outliers
- Decide whether to cap or remove outliers based on business logic
Step 5: Univariate Analysis
- Analyze individual variables
- Numeric: Distribution plots, histograms
sns.histplot(data[‘Revenue’], bins=20, kde=True)
plt.show()
- Categorical: Count plots
sns.countplot(x=’Product’, data=data)
plt.show()
Step 6: Bivariate & Multivariate Analysis
- Explore relationships between variables
- Numeric vs Numeric: Scatter plots, correlation matrices
sns.scatterplot(x=’Quantity’, y=’Revenue’, data=data)
plt.show()
sns.heatmap(data.corr(), annot=True, cmap=’coolwarm’)
plt.show()
- Categorical vs Numeric: Boxplots, barplots
sns.boxplot(x=’Region’, y=’Revenue’, data=data)
plt.show()
Step 7: Feature Engineering
- Extract day, month, or weekday from date columns
data[‘Order_Date’] = pd.to_datetime(data[‘Order_Date’])
data[‘Weekday’] = data[‘Order_Date’].dt.day_name()
- Create new metrics like revenue per quantity
data[‘Revenue_per_Unit’] = data[‘Revenue’] / data[‘Quantity’]
Step 8: Summarizing Insights
| Step | Technique/Function | Purpose |
| Initial Inspection | head(), info(), describe() | Understand structure & summary statistics |
| Missing Values | isnull(), fillna() | Handle gaps in data |
| Outlier Detection | boxplot(), IQR | Identify extreme values |
| Univariate Analysis | histplot(), countplot() | Explore individual variables |
| Bivariate Analysis | scatterplot(), boxplot(), heatmap() | Identify relationships between variables |
| Feature Engineering | dt.day_name(), arithmetic columns | Create new metrics for insights |
EDA Workflow (Textual Flowchart)
Start
│
├── Step 1: Load Dataset & Libraries
│
├── Step 2: Inspect Dataset (head, info, describe)
│
├── Step 3: Handle Missing Values
│
├── Step 4: Detect & Treat Outliers
│
├── Step 5: Univariate Analysis (Numeric & Categorical)
│
├── Step 6: Bivariate & Multivariate Analysis
│
├── Step 7: Feature Engineering (Dates, Metrics)
│
└── Step 8: Summarize Insights for Reporting & Modeling
Step 9: Real-World Scenario
Scenario: A retail chain in Nagpur wants insights for the festive season:
- Load sales dataset
- Identify top-selling products and regions
- Detect outliers in revenue (e.g., unusually high or low orders)
- Examine weekly trends to optimize marketing campaigns
- Engineer Revenue_per_Unit to track product profitability
Outcome: Analysts generate a comprehensive EDA report highlighting patterns, anomalies, and actionable business insights.
At CuriosityTech.in, learners complete hands-on EDA projects with datasets from retail, finance, and healthcare sectors in Nagpur, developing a methodical approach to analysis.
Common Mistakes in EDA
- Ignoring missing data → distorted patterns
- Overlooking outliers → skewed insights
- Jumping to conclusions without visualization
- Ignoring categorical variables
- Not documenting findings → difficult to share insights
Tips to Master EDA
- Practice EDA on diverse datasets
- Combine visual and numerical methods for better insights
- Document steps & assumptions
- Use Python (Pandas, Matplotlib, Seaborn) efficiently
- CuriosityTech.in encourages learners to present EDA reports interactively, connecting Python outputs to dashboards
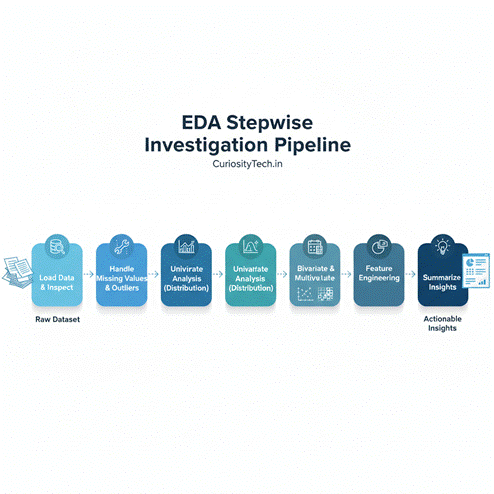
Infographic Description: “EDA Stepwise Investigation Pipeline”
- Stage 1: Load Data & Inspect
- Stage 2: Handle Missing Values & Outliers
- Stage 3: Univariate Analysis (Distribution)
- Stage 4: Bivariate & Multivariate Analysis
- Stage 5: Feature Engineering
- Stage 6: Summarize Insights
Visualize as a linear investigation flow, showing data transformation from raw dataset → cleaned → analyzed → insights.
Conclusion
Exploratory Data Analysis is the foundation of every successful data project. By understanding distributions, relationships, and anomalies, analysts can generate actionable insights and prepare datasets for advanced modeling.
At CuriosityTech.in, learners in Nagpur gain hands-on EDA experience, connecting Python analysis to dashboards and executive reporting. Contact +91-9860555369 or contact@curiositytech.in to start mastering EDA step-by-step.
