Introduction
In cloud environments, visibility into application and infrastructure performance is critical. Without proper logging and monitoring, troubleshooting, performance optimization, and compliance become impossible. Google Cloud Operations Suite (formerly Stackdriver) provides a comprehensive suite of tools for logging, monitoring, tracing, and alerting in GCP.
At Curiosity Tech , we emphasize mastering these tools because engineers must proactively detect issues, optimize performance, and ensure reliability in production-grade applications. This guide provides an in-depth understanding of Cloud Logging, Cloud Monitoring, Cloud Trace, and Cloud Debugger, with practical examples and strategic insights.
What is Google Cloud Operations Suite?
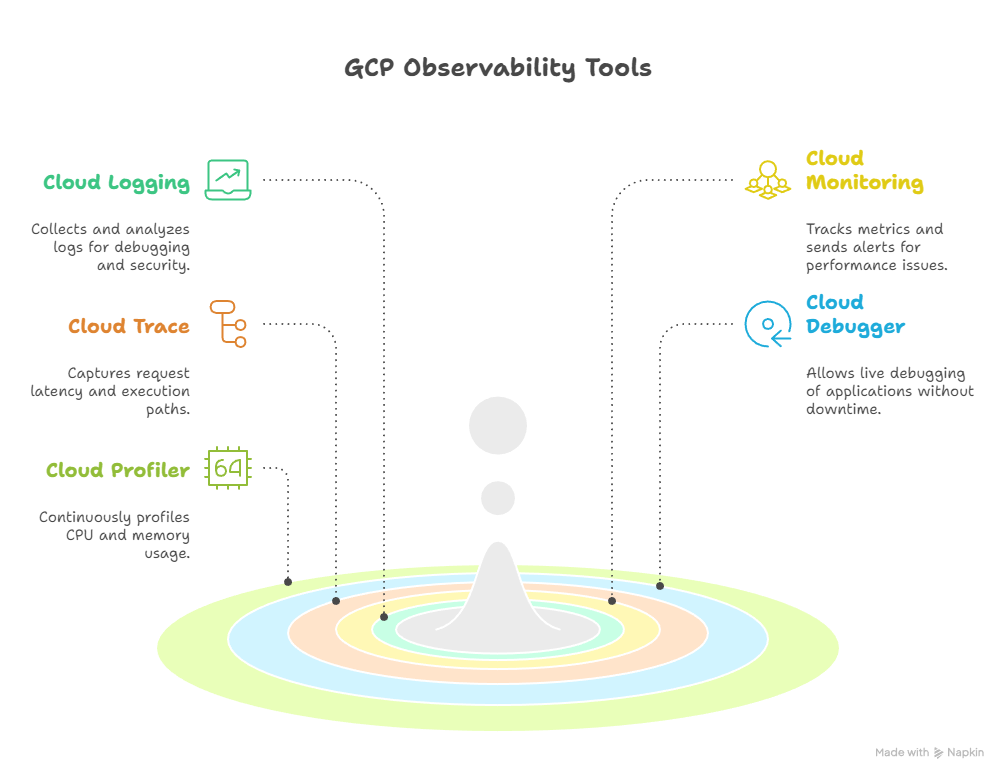
Google Cloud Operations Suite is a fully integrated observability platform for GCP, combining:
- Cloud Logging: Centralized log management.
- Cloud Monitoring: Metrics collection, dashboards, and alerts.
- Cloud Trace: Distributed request latency analysis.
- Cloud Debugger: Real-time inspection of applications.
- Cloud Profiler: Performance profiling of production applications.
These tools enable engineers to monitor infrastructure, debug applications, and analyze performance trends efficiently.
Core Components Explained:-
| Component | Description | Use Case / Example |
| Cloud Logging | Collects, stores, and analyzes logs from GCP resources and applications. | Debugging errors, security auditing |
| Cloud Monitoring | Tracks metrics, visualizes dashboards, and sends alerts. | CPU usage, memory, latency, request counts |
| Cloud Trace | Captures request latency and execution paths across services. | Identifying slow API calls or microservices |
| Cloud Debugger | Attach debugger to live applications without downtime. | Inspect live production code |
| Cloud Profiler | Continuous profiling of CPU and memory usage. | Optimize code performance and reduce cost |
Diagram Concept: Observability Architecture
Cloud Logging:-
Cloud Logging is the central log repository for GCP, aggregating logs from:
- Compute Engine
- GKE Clusters
- Cloud Functions
- App Engine
- Cloud Load Balancers
Key Features:
- Real-time log ingestion
- Advanced queries using Logs Explorer
- Export to BigQuery or Cloud Storage for long-term analytics
- Log-based metrics for monitoring trends
Example Query: Errors in GKE Pods
resource.type=”k8s_container”
severity=”ERROR”
timestamp >= “2025-09-01T00:00:00Z”
Cloud Monitoring:-
Cloud Monitoring collects metrics and telemetry data from your GCP resources and custom applications.
Features:
- Prebuilt dashboards for GCP services
- Custom dashboards for application-specific metrics
- Alerts and notifications via email, SMS, Slack, or PagerDuty
- Uptime checks and SLO/SLA monitoring
Example: CPU Usage Alert
- Metric: compute.googleapis.com/instance/cpu/utilization
- Condition: CPU > 80% for 5 minutes
- Action: Send email to DevOps team
Cloud Trace & Debugger:-
Cloud Trace provides latency insights for distributed applications. Engineers can see request paths, detect bottlenecks, and optimize performance.
Cloud Debugger allows live inspection of running applications without stopping them. Combined, these tools provide end-to-end observability.
Practical Example:
- Trace a slow checkout request in an e-commerce app.
- Identify latency caused by database queries.
- Debug the specific service code in production using Cloud Debugger.
Advanced Practices for Observability:-
- Centralize Logs: Consolidate all logs in Cloud Logging, including custom application logs.
- Create Dashboards: Use Cloud Monitoring to create team-specific dashboards for real-time insights.
- Implement Alerts: Proactively detect performance degradation or failures.
- Use Log-Based Metrics: Convert frequent log patterns into metrics for monitoring and alerting.
- Integrate with CI/CD Pipelines: Monitor deployments and performance regressions automatically.
Curiosity Tech labs teach engineers to build observability pipelines combining Logging, Monitoring, and Trace to simulate enterprise-level applications.
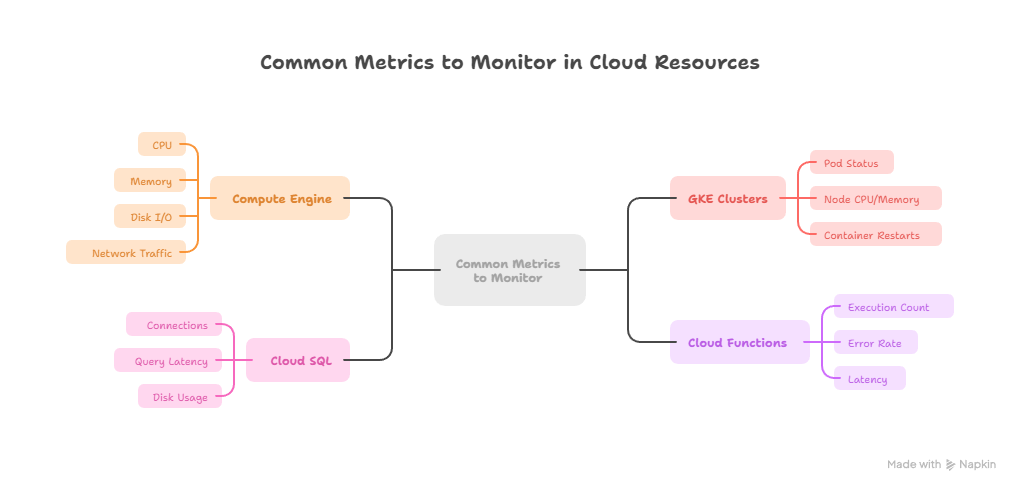
Practical Scenario: Multi-Service Monitoring
Scenario: An online marketplace with multiple microservices deployed on GKE.
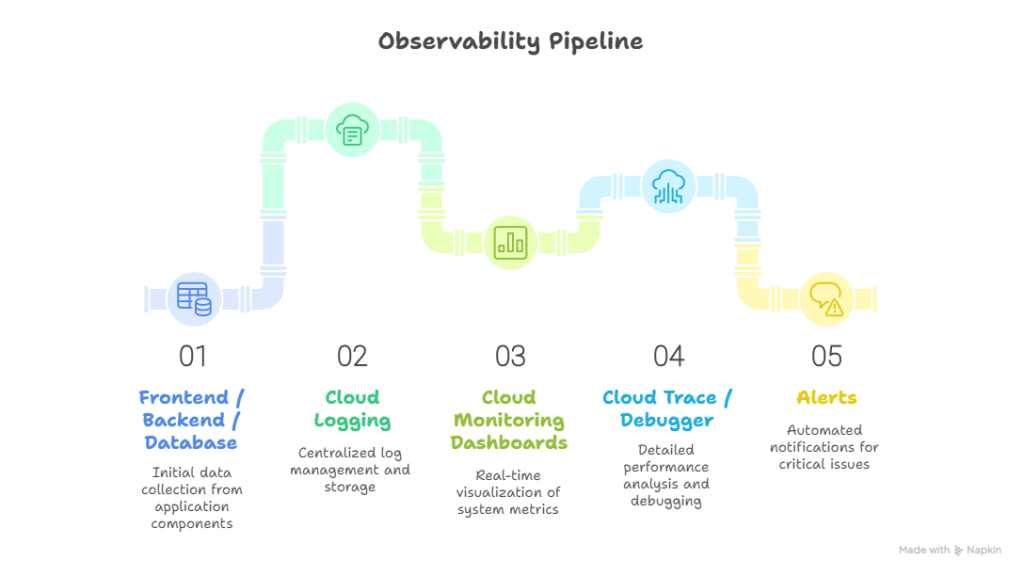
- Logging: All container logs collected in Cloud Logging.
- Monitoring: CPU, memory, and request latency dashboards.
- Tracing: Track requests from frontend to backend and database.
- Alerts: Notify DevOps if pod restarts exceed a threshold or API latency > 2 seconds.
Diagram Concept: Observability Pipeline
Conclusion:
Mastering Google Cloud Operations Suite equips cloud engineers to monitor, troubleshoot, and optimize applications effectively. By combining logging, monitoring, tracing, and debugging, engineers can ensure high availability, performance, and reliability in GCP workloads.
At Curiosity Tech , engineers gain hands-on experience building observability pipelines, real-time dashboards, and alerting systems, preparing them to manage enterprise cloud applications with confidence.