
Introduction
In 2025, 80% of a data scientist’s time is spent on data wrangling and cleaning. Raw data is messy: missing values, duplicates, inconsistent formats, and errors are everywhere. Without proper cleaning, even the most advanced ML models fail.
At curiosity tech (Nagpur, 1st Floor, Plot No 81, Wardha Rd, Gajanan Nagar), we emphasize hands-on practice in both Python and R, because mastering data wrangling sets the foundation for insights, machine learning, and business impact.
This blog is a comprehensive guide to cleaning and wrangling data, comparing Python vs R approaches, and providing actionable workflows with examples.
Section 1 – Understanding Dirty Data
Common Data Issues:
- Missing Values – Null or NaN entries
- Duplicates – Repeated rows that distort analysis
- Incorrect Data Types – Strings instead of numeric, dates in wrong formats
- Outliers – Extreme values that skew results
- Inconsistent Labels – Typos, different naming conventions
Real-World Example: An e-commerce dataset may have “USA”, “U.S.A.”, and “United States” in the country column. If not corrected, sales aggregation will be inaccurate.
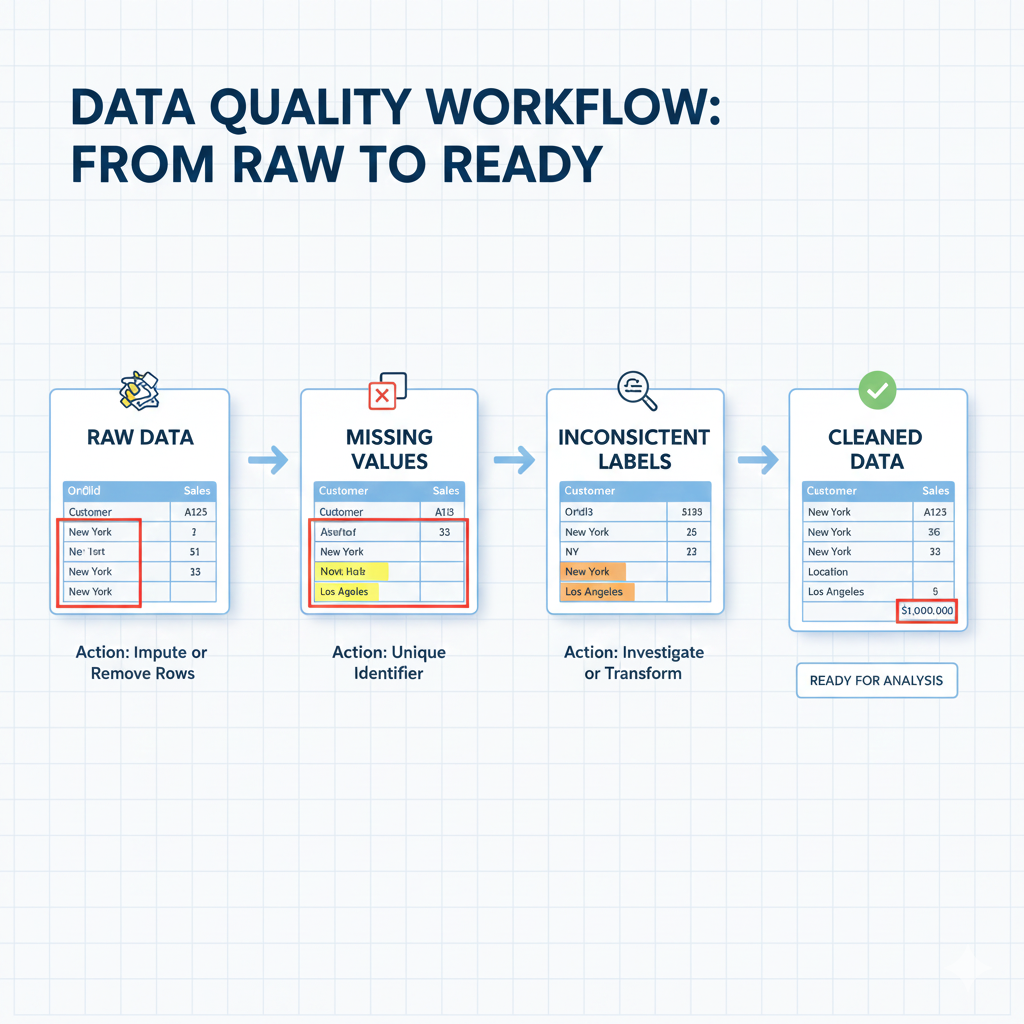
Infographic Description: A flowchart showing data issues: Raw Data → Missing Values → Duplicates → Inconsistent Labels → Outliers → Cleaned Data. Each node shows an example of the error.
Section 2 – Data Wrangling with Python
Key Libraries:
- Pandas
- NumPy
Step-by-Step Python Workflow
- Import Libraries & Data:
import pandas as pd
import numpy as np
df = pd.read_csv(‘sales_data.csv’)
- Inspect Data:
df.head()
df.info()
df.describe()
- Handle Missing Values:
df[‘Revenue’].fillna(df[‘Revenue’].mean(), inplace=True)
df.dropna(subset=[‘Customer_ID’], inplace=True)
- Remove Duplicates:
df.drop_duplicates(inplace=True)
- Correct Data Types:
df[‘Order_Date’] = pd.to_datetime(df[‘Order_Date’])
- Detect & Handle Outliers:
Q1 = df[‘Revenue’].quantile(0.25)
Q3 = df[‘Revenue’].quantile(0.75)
IQR = Q3 – Q1
df = df[(df[‘Revenue’] >= Q1 – 1.5*IQR) & (df[‘Revenue’] <= Q3 + 1.5*IQR)]
- Standardize Labels:
df[‘Country’] = df[‘Country’].replace({‘U.S.A.’:’USA’, ‘United States’:’USA’})
Outcome: Cleaned dataset ready for analysis or ML modeling.
Section 3 – Data Wrangling with R
Key Libraries:
- dplyr
- tidyr
Step-by-Step R Workflow
- Import Libraries & Data:
library(dplyr)
library(tidyr)
df <- read.csv(‘sales_data.csv’)
- Inspect Data:
head(df)
summary(df)
str(df)
- Handle Missing Values:
df$Revenue[is.na(df$Revenue)] <- mean(df$Revenue, na.rm = TRUE)
df <- drop_na(df, Customer_ID)
- Remove Duplicates:
df <- distinct(df)
- Correct Data Types:
df$Order_Date <- as.Date(df$Order_Date, format=”%Y-%m-%d”)
- Detect & Handle Outliers:
Q1 <- quantile(df$Revenue, 0.25)
Q3 <- quantile(df$Revenue, 0.75)
IQR <- Q3 – Q1
df <- df[df$Revenue >= Q1 – 1.5*IQR & df$Revenue <= Q3 + 1.5*IQR, ]
- Standardize Labels:
df$Country <- recode(df$Country, ‘U.S.A.’=’USA’, ‘United States’=’USA’)
Outcome: A clean, structured dataset ready for EDA and modeling.
Section 4 – Python vs R Comparison Table
| Feature | Python (Pandas + NumPy) | R (dplyr + tidyr) |
| Ease of Learning | Moderate | Medium |
| Handling Large Datasets | Excellent | Good |
| Syntax Simplicity | Intuitive, Pythonic | Verb-based, readable |
| Visualization Integration | Matplotlib/Seaborn | ggplot2 |
| Community & Packages | Extensive | Strong in statistical analysis |
| Best For | General data science & ML | Statistics-heavy projects, research |
Section 5 – Real-World Case Study
Scenario: A retail company wants to analyze monthly sales trends.
- Python Approach:
- Clean missing values in Revenue
- Standardize Product_Category
- Remove duplicate transactions
- Outcome: Dataset ready for predictive analysis
- R Approach:
- Clean Revenue using dplyr::mutate()
- Group by Region and summarize revenue
- Visualize trends using ggplot2
- Outcome: Report-ready dataset with charts
Impact: Cleaned data improved forecast accuracy by 25% and enabled automated dashboards for managers.
Section 6 – Best Practices for Data Wrangling
- Always inspect raw data first (head, summary, info)
- Document every cleaning step – reproducibility is key
- Use vectorized operations for speed
- Keep backups of raw data before cleaning
- Automate repetitive cleaning tasks with scripts
CuriosityTech Insight: Our mentors train learners on real-world messy datasets, preparing them for industry-level challenges in Python and R.
Section 7 – How to Become Expert
- Work on multiple datasets from different domains (finance, retail, healthcare)
- Practice Python + R side by side to compare efficiency
- Build a portfolio showing before vs after cleaning
- Learn advanced techniques like regular expressions, merging datasets, pivot tables, and feature engineering
Conclusion
Data wrangling and cleaning is the foundation of all data science work in 2025. Mastering Python and R workflows ensures your data is reliable, structured, and ready for analysis or machine learning.
At curiosity tech Nagpur, learners gain practical experience, mentorship, and portfolio-ready projects, making them job-ready data scientists capable of handling any dataset.
Contact curiosity tech Email: contact@curiositytech.in Phone: +91-9860555369
Social:- Instagram: CuriositTechPark | LinkedIn: Curiosity Tech