

Introduction
In the modern business landscape, data drives decisions. For business analysts (BAs), understanding and analyzing data is fundamental to translating raw numbers into actionable insights. Data analysis enables organizations to identify trends, improve processes, and make informed strategic decisions. At Curiosity Tech (website: curiositytech.in, Phone: +91- 9860555369, Email: contact@curiositytech.in), we train professionals in data analysis techniques, tools, and visualization, equipping them to bridge business objectives and analytical insights effectively.
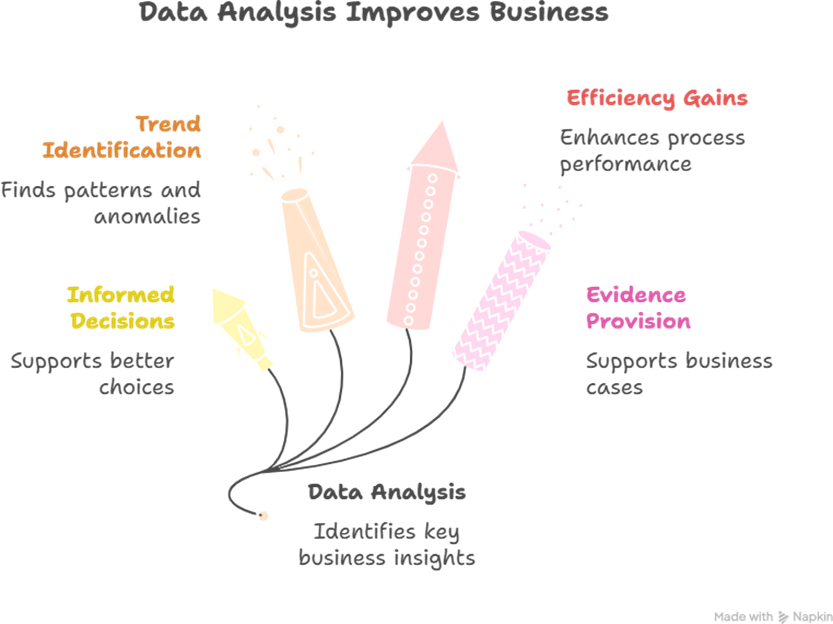
- Importance of Data Analysis for BAs
- Types of Data BAs Work With
| Data Type | Description | Example Use Case |
| Quantitative Data | Numerical data for measurement & analysis | Sales numbers, customer counts, revenue |
| Qualitative Data | Descriptive data for insights | Customer feedback, interviews, surveys |
| Structured Data | Organized in rows and columns | Databases, Excel sheets |
| Unstructured Data | Text, images, or multimedia content | Emails, chat logs, social media posts |
Tip: A skilled BA knows how to combine multiple data types to create a holistic view of business operations.
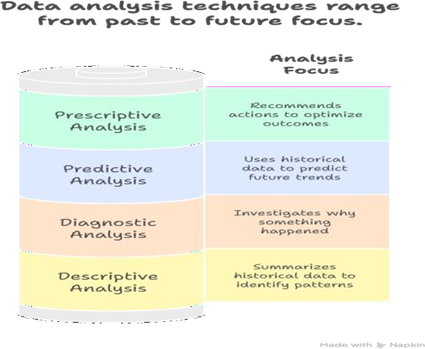
- Core Data Analysis Techniques for BAs
- Step-by-Step Data Analysis Process
- Essential Tools for Data Analysis
| Tool | Purpose | Notes |
| Microsoft Excel | Data cleaning, pivot tables, charts | Beginner-friendly, widely used |
| Power BI / Tableau | Data visualization & dashboards | Interactive dashboards for stakeholders |
| SQL | Querying and extracting structured data | Essential for database analysis |
| Python / R | Advanced statistical analysis | Predictive & prescriptive analytics |
Curiosity Tech Practical Exercise: Analysts use Excel for cleaning and visualization, then move to Power BI dashboards to present insights to stakeholders, bridging the gap between raw data and business decisions.
- Common Data Analysis Metrics for BAs
| Metric | Purpose | Example Use Case |
| Revenue Growth Rate | Measures financial performance | Compare sales YoY |
| Customer Churn Rate | Tracks customer retention | Identify risk of lost customers |
| Process Efficiency | Evaluates operational productivity | Monitor average time for order fulfillment |
| Error Rate / Defect Rate | Quality and performance measurement | Track software bug rates |
| KPI Achievement | Measures goal alignment | Percentage of project goals achieved |
- Practical Example – Nagpur-Based Client
A retail client wanted to optimize inventory. Process:
- Collected historical sales and stock data
- Cleaned and normalized the data in Excel
- Conducted descriptive and diagnostic analysis to find stockouts and overstock patterns
- Visualized insights in Power BI dashboards
- Recommended adjustments in stock replenishment and reorder levels
Result: Inventory discrepancies reduced by 40%, ensuring better product availability and cost efficiency.
- Tips for BAs to Excel in Data Analysis
- Learn to interpret data, not just analyze it; focus on actionable insights
- Practice data visualization for easy stakeholder understanding
- Build skills in SQL and Excel for structured data analysis
- Explore Python or R for advanced predictive modeling
- Continuously update knowledge on emerging data analysis trends
Curiosity Tech Edge: Our analysts gain hands-on experience in both tools and methodologies, enabling them to transform raw data into strategic business decisions.
conclusion
Data analysis is the backbone of business decision-making. For business analysts, mastering data collection, cleaning, visualization, and interpretation ensures that stakeholders receive reliable, actionable insights. At Curiosity Tech, analysts are trained to use the right
tools, techniques, and communication strategies to transform business data into measurable outcomes, ensuring organizations can make informed decisions, optimize operations, and achieve strategic goals.
