Introduction (Predictive Modeling & Forecasting Style)
Predictive analytics allows businesses to forecast future trends and make proactive decisions. In 2025, organizations from retail to healthcare rely on predictive models to anticipate demand, optimize operations, and increase revenue.
Imagine a retail chain in Nagpur wanting to forecast next month’s sales or predict which customers are likely to churn. Raw data and descriptive statistics help understand the past, but predictive analytics informs the future.
At curiositytech.in learners are trained in predictive modeling workflows, combining Python, Excel, and SQL to forecast sales, customer behavior, and business KPIs.
Step 1: Understanding Predictive Analytics
- Definition: Predictive analytics uses historical data and statistical/machine learning models to predict future outcomes.
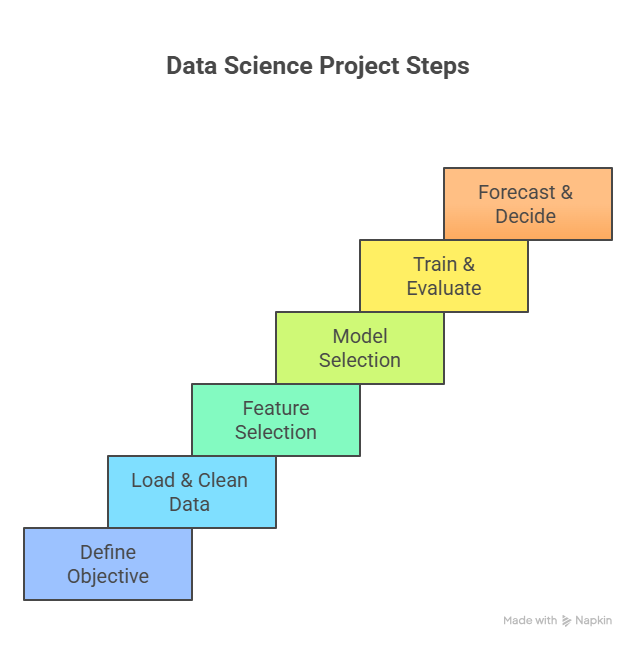
- Key Steps:
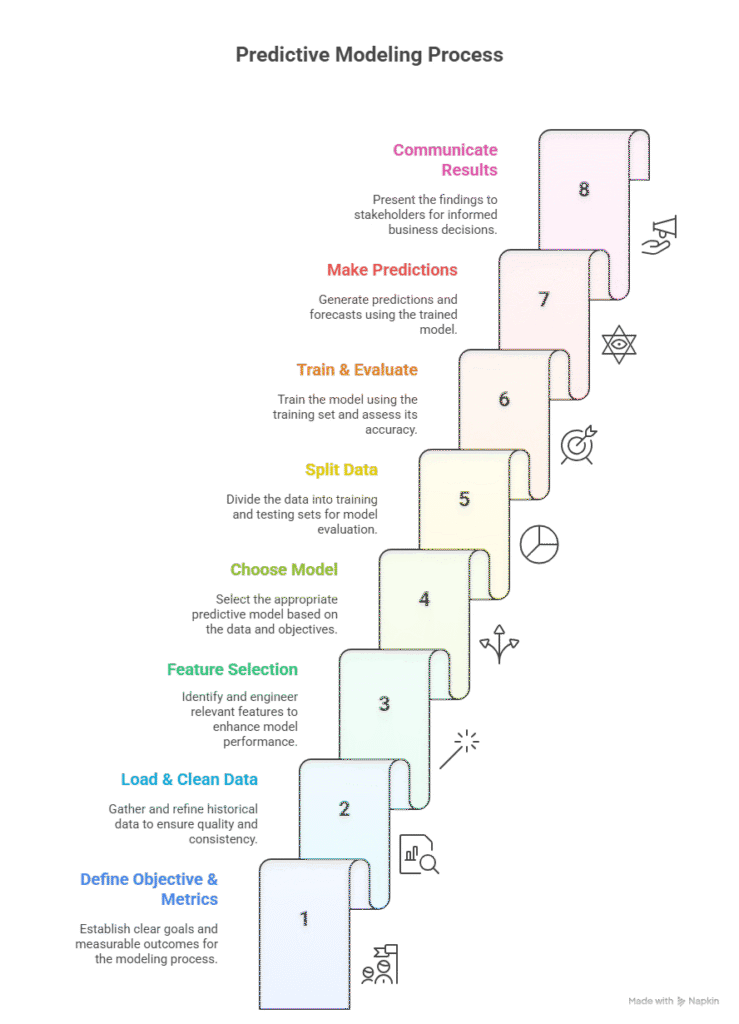
- Define objective (e.g., sales forecast, churn prediction)
- Collect and clean historical data
- Feature selection/engineering
- Model selection (linear regression, decision trees, etc.)
- Train and validate model
- Evaluate accuracy and deploy predictions
Step 2: Types of Predictive Models
| Model Type | Description | Example Use Case |
| Regression | Predict continuous numeric outcomes | Forecasting monthly sales |
| Classification | Predict categorical outcomes | Predict customer churn (Yes/No) |
| Time Series Forecasting | Analyze trends over time | Weekly revenue prediction |
| Clustering (Unsupervised) | Group similar entities without labels | Customer segmentation |
| Ensemble Models | Combine multiple models for accuracy | Predict high-value customers |
Step 3: Predictive Modeling Workflow

Step 4: Example – Predicting Sales in Python
import pandas as pd
from sklearn.model_selection import train_test_split
from sklearn.linear_model import LinearRegression
from sklearn.metrics import mean_squared_error
data = pd.read_csv(“nagpur_sales.csv”)
# Features: Advertising Spend, Month, Store Traffic
X = data[[‘Advertising’, ‘Month’, ‘Traffic’]]
y = data[‘Revenue’]
# Split data
X_train, X_test, y_train, y_test = train_test_split(X, y, test_size=0.2, random_state=42)
# Train model
model = LinearRegression()
model.fit(X_train, y_train)
# Predict
y_pred = model.predict(X_test)
# Evaluate
mse = mean_squared_error(y_test, y_pred)
print(“Mean Squared Error:”, mse)
Outcome: The analyst can forecast sales for upcoming months and adjust inventory or marketing strategies proactively.
Step 5: Example – Customer Churn Prediction
- Objective: Predict if a customer will churn (Yes/No)
- Model: Logistic Regression / Decision Tree
- Features: Last purchase date, total spend, frequency, customer support interactions
from sklearn.linear_model import LogisticRegression
from sklearn.metrics import accuracy_score
X = data[[‘LastPurchaseDays’, ‘TotalSpend’, ‘Frequency’]]
y = data[‘Churn’]
model = LogisticRegression()
model.fit(X_train, y_train)
y_pred = model.predict(X_test)
accuracy = accuracy_score(y_test, y_pred)
print(“Accuracy:”, accuracy)
Outcome: Retention team can target high-risk customers with personalized campaigns.
Step 6: Predictive Analytics in Excel
- Regression Analysis: Data → Data Analysis → Regression
- Forecast Sheet: Data → Forecast Sheet → Select target variable
- Pivot Table & Charts: For trend analysis and visualization
Tip: Excel is suitable for small datasets and preliminary predictive analysis.
Step 7: Predictive Analytics Workflow Table
| Step | Technique / Tool | Purpose |
| Define Objective | Business Understanding | Decide what to predict (sales, churn, etc.) |
| Load & Clean Data | Python, Excel, SQL | Prepare historical dataset |
| Feature Selection | Correlation, EDA | Identify relevant variables |
| Model Selection | Regression, Classification | Choose appropriate predictive method |
| Train & Test Split | Python scikit-learn | Validate model performance |
| Model Evaluation | MSE, Accuracy, Confusion Matrix | Measure predictive accuracy |
| Forecast & Communicate | Python, Excel, Power BI/Tableau | Present actionable insights |
Infographic Description: “Predictive Analytics Pipeline”

Step 8: Real-World Scenario
Scenario: Nagpur retail chain wants to forecast next quarter sales and identify high-risk churn customers:
- Load 3 years of sales data
- Conduct EDA and feature engineering
- Train Linear Regression for revenue forecasting
- Train Logistic Regression for churn prediction
- Evaluate models and present results in Power BI dashboards
Outcome: Company can plan inventory, marketing campaigns, and retention strategies effectively.
At CuriosityTech.in, learners practice predictive analytics workflows on retail, finance, and healthcare datasets in Nagpur, combining Python, Excel, and BI tools to build practical forecasting skills.
Common Mistakes
- Using irrelevant features → reduces model accuracy
- Ignoring data cleaning → leads to incorrect predictions
- Overfitting → model performs well on training data but poorly on new data
- Misinterpreting results → poor business decisions
- Not validating predictions → reduces reliability
Tips to Master Predictive Analytics
- Start with small datasets for regression/classification practice
- Learn feature engineering techniques for better models
- Evaluate models rigorously using metrics (MSE, Accuracy, F1-Score)
- Integrate predictive outputs into dashboards or reports
- CuriosityTech.in trains learners in hands-on predictive projects, preparing them for real-world analytics challenges
Conclusion
Predictive analytics enables data analysts to forecast trends, optimize business strategies, and reduce uncertainty. Mastering predictive models is essential for staying competitive in 2025.
At curiositytech.in learners in Nagpur gain practical skills in predictive analytics, combining Python, Excel, and visualization tools to deliver actionable forecasts for real-world business scenarios. Contact +91-9860555369 or contact@curiositytech.in to begin your predictive analytics journey.


