Introduction (Case Study Style)
Customer churn—when a client stops using a service or product—is a critical KPI for businesses. Reducing churn directly impacts revenue, customer retention, and growth.
Imagine a Nagpur-based telecom company that wants to identify why customers leave and predict who might churn. Using SQL to extract customer data and Python for analysis and modeling, analysts can generate actionable insights to retain high-risk customers.
At CuriosityTech.in, learners are trained on real-world churn datasets, learning to combine SQL querying, Python analytics, and visualization techniques for business decisions.
Step 1: Define Objectives
- Identify customers at risk of churn
- Understand factors influencing churn (usage, tenure, demographics)
- Provide actionable insights to reduce churn
- Build a predictive model for early detection
Dataset Columns: Customer_ID, Age, Gender, Tenure (months), Monthly Charges, Total Charges, Contract Type, Payment Method, Churn (Yes/No).
Step 2: Extract Data Using SQL
Key SQL Queries:
- Total Customers by Contract Type:
SELECT ContractType, COUNT(*) AS TotalCustomers
FROM Customers
GROUP BY ContractType;
- Churn Count by Contract Type:
SELECT ContractType, COUNT(*) AS ChurnedCustomers
FROM Customers
WHERE Churn=’Yes’
GROUP BY ContractType;
- Average Monthly Charges by Churn Status:
SELECT Churn, AVG(MonthlyCharges) AS AvgMonthlyCharges
FROM Customers
GROUP BY Churn;
- Top 10 High-Risk Customers:
SELECT Customer_ID, Tenure, MonthlyCharges
FROM Customers
WHERE Churn=’Yes’
ORDER BY MonthlyCharges DESC
LIMIT 10;
Tip: SQL ensures clean, aggregated, and structured data before Python analysis.
Step 3: Analyze Data in Python
import pandas as pd
import seaborn as sns
import matplotlib.pyplot as plt
from sklearn.model_selection import train_test_split
from sklearn.ensemble import RandomForestClassifier
from sklearn.metrics import classification_report, confusion_matrix
# Load dataset
data = pd.read_csv(‘nagpur_churn.csv’)
# Basic EDA
print(data.info())
print(data.describe())
print(data[‘Churn’].value_counts())
# Visualize churn by contract type
sns.countplot(x=’ContractType’, hue=’Churn’, data=data)
plt.show()
# Prepare features and labels
X = data[[‘Tenure’, ‘MonthlyCharges’, ‘TotalCharges’]]
y = data[‘Churn’].map({‘Yes’:1, ‘No’:0})
# Split dataset
X_train, X_test, y_train, y_test = train_test_split(X, y, test_size=0.2, random_state=42)
# Train Random Forest Classifier
model = RandomForestClassifier(n_estimators=100, random_state=42)
model.fit(X_train, y_train)
# Predict & Evaluate
y_pred = model.predict(X_test)
print(confusion_matrix(y_test, y_pred))
print(classification_report(y_test, y_pred))
Outcome:
- Identifies high-risk customers
- Highlights factors contributing to churn
- Predictive model achieves accuracy and actionable insights
Step 4: Key Metrics to Track
| Metric | Purpose | Python / SQL Function Example |
| Churn Rate | % of customers leaving | SQL: COUNT WHERE Churn=’Yes’/Total |
| Average Tenure | Average duration of customer engagement | Python: data[‘Tenure’].mean() |
| Monthly Charges vs Churn | Identify pricing influence | Seaborn countplot / bar chart |
| Contract Type vs Churn | Understand plan impact | SQL group by + Python countplot |
| Top-Risk Customers | Prioritize retention efforts | SQL ORDER BY + LIMIT, Python sort_values() |
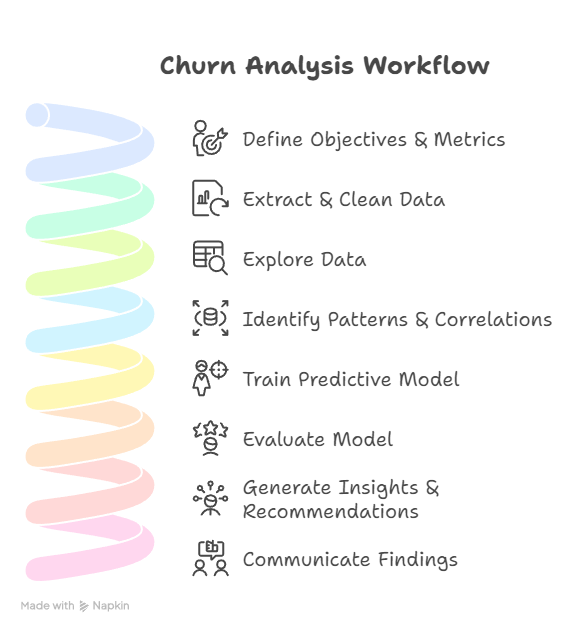
Step 5: Churn Analysis Workflow Diagram
Step 6: Visualization Recommendations
- Countplot / Bar Chart: Churn by contract type or payment method
- Boxplot: Monthly charges vs churn status
- Heatmap: Correlation between numerical variables (Tenure, Charges, Churn)
- Feature Importance Plot: Identify key predictors from Random Forest
Tip: Visualizations enhance stakeholder understanding and drive actionable decisions.
Step 7: Common Pitfalls in Churn Analysis
- Ignoring missing or inconsistent data → inaccurate predictions
- Using unbalanced datasets → biased model
- Overfitting predictive model → poor performance on new customers
- Misinterpreting correlation as causation → wrong business actions
- Not validating model with test set → unreliable insights
Solution: Apply data cleaning, balance classes, cross-validation, and domain knowledge checks.
Step 8: Real-World Scenario Outcome
Scenario: Nagpur telecom executes analysis:
- High churn detected among month-to-month contract customers
- Customers with higher monthly charges churn more frequently
- Predictive model identifies top 10 high-risk customers
- Actionable insights:
- Offer discounts or loyalty programs for high-risk customers
- Upgrade marketing campaigns for monthly contract subscribers
- Adjust pricing or provide flexible plans
At CuriosityTech.in, learners simulate this case study, applying SQL and Python on real datasets, understanding why churn occurs, how to predict it, and how to recommend actionable strategies.
Step 9: Tips to Master Churn Analysis
- Always clean and validate data
- Perform exploratory data analysis to understand patterns
- Choose appropriate predictive models (Random Forest, Logistic Regression)
- Track accuracy, precision, recall, F1-score
- Visualize insights for stakeholder communication
At CuriosityTech.in, learners practice multiple churn scenarios, gaining practical experience to reduce customer attrition effectively
Conclusion
Customer churn analysis combines SQL data extraction, Python analytics, and visualization techniques to provide actionable business insights. Mastering this skill helps companies retain customers, improve revenue, and optimize marketing strategies.
At CuriosityTech.in, learners in Nagpur gain hands-on experience analyzing churn datasets, building predictive models, and generating reports that guide strategic decision-making in 2025. Contact +91-9860555369 or contact@curiositytech.in to start mastering churn analysis with SQL & Python.