Introduction (Narrative Style)
Every beginner in 2025 eventually asks :- “Which data analysis tool should I learn first? Excel? SQL? Python? Or do I jump straight into Power BI and Tableau?”
The reality is, there is no single “best tool”. Instead, there’s a toolbox, and like a craftsman, an analyst must pick the right tool for the job.
In my 20+ years of teaching and practicing analytics, I’ve seen analysts struggle not because they lack knowledge, but because they rely on the wrong tool for the wrong problem. At CuriosityTech.in, when we guide learners in Nagpur or online, we emphasize knowing when to use what.
The Big Five Data Analysis Tools of 2025
1. Excel: The Universal Entry Point
- Strengths: User-friendly, pivot tables, quick charts, formulas.
- Limitations: Struggles with large datasets (>1M rows), limited automation.
- Best For: Beginners, quick reporting, small to medium datasets.
- Example: Monthly sales report of a retail store in Nagpur.
2. SQL: The Language of Databases
- Strengths: Handles large structured data, efficient queries, relational database power.
- Limitations: Limited visualization, requires structured schema.
- Best For: Extracting and filtering large datasets before analysis.
- Example: Querying customer purchase history for a telecom company.
3. Python: The Powerhouse of Data Science
- Strengths: Libraries (Pandas, NumPy, Scikit-learn, Matplotlib), machine learning, automation.
- Limitations: Requires programming mindset, slower learning curve.
- Best For: Predictive analytics, machine learning, data cleaning at scale.
- Example: Building a churn prediction model for an e-commerce startup.
4. Power BI: Business-Focused Dashboards
- Strengths: Microsoft ecosystem integration, interactive dashboards, DAX language.
- Limitations: Limited in handling extremely large data, some learning curve
- Best For: Business reporting, executive dashboards, self-service BI.
- Example: Sales dashboard for a manufacturing company’s board meeting.
5. Tableau: Stunning Visual Storytelling
- Strengths: Advanced visualizations, drag-and-drop interface, storytelling capabilities.
- Limitations: Cost, needs structured data.
- Best For: Data storytelling, presentations to non-technical stakeholders.
- Example: Visualizing COVID-19 trends by geography for public awareness.
Pros & Cons Table
| Tool | Pros | Cons | Best Learners |
| Excel | Easy to start, widely used, formulas | Limited scalability, error-prone | Beginners, business users |
| SQL | Handles large data, precise querying | Poor visualization, needs schema | Analysts, backend users |
| Python | Flexible, ML ready, automation | Coding required, steeper learning curve | Aspiring data scientists |
| Power BI | Strong business integration, dashboards | Limited customization vs. Tableau | BI analysts, managers |
| Tableau | Advanced visuals, presentation quality | Expensive, less coding flexibility | Storytellers, consultants |
Real-World Use Case Scenarios
- Startup Founder in Nagpur: Uses Excel for quick financial models, then moves to Power BI dashboards for investors.
- Bank Data Analyst: Extracts loan transaction records via SQL, cleans with Python, and presents in Tableau.
- Healthcare Data Scientist: Applies Python machine learning to predict patient risk, shares results through Power BI dashboards.
Tool Adoption Path (Hierarchical Diagram – Textual Description)
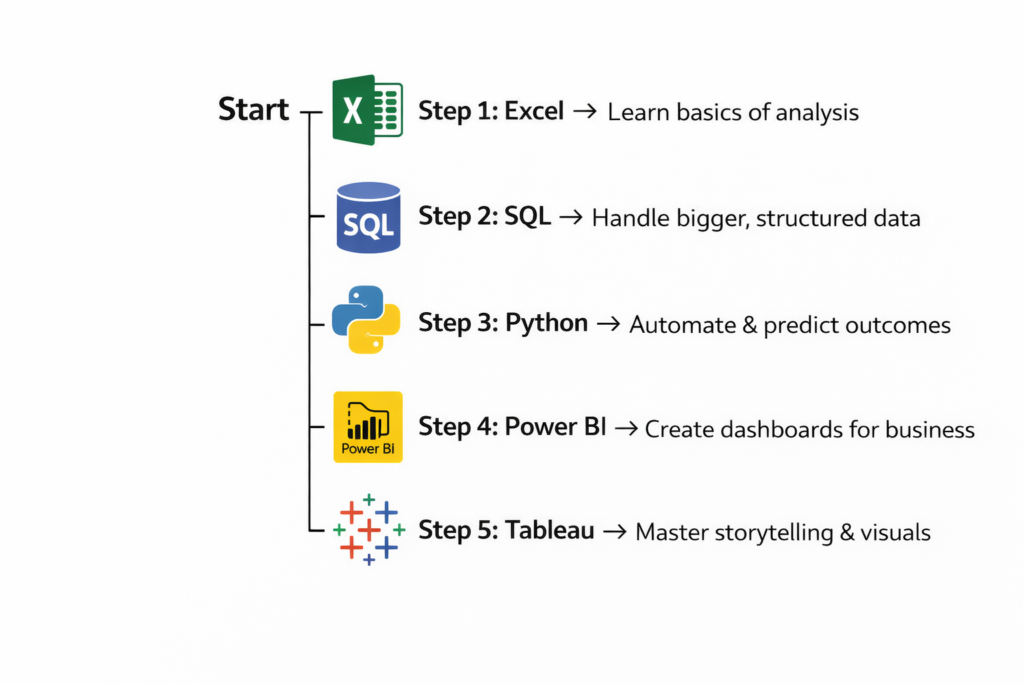
This is the same roadmap we recommend at CuriosityTech Park, Wardha Rd, Nagpur, during career counseling sessions.
Career Tip Abstraction (Decision Guide)
- If you are from a non-tech background → Start with Excel & Power BI.
- If you love coding → Prioritize Python & SQL.
- If you are a business communicator → Excel + Tableau is a great combo.
Our students often reach us through Instagram (CuriosityTech Park) or email (contact@curiositytech.in) asking “Should I learn Python or Power BI first?” The answer depends on their career aspiration.
Infographic Description: “Which Tool for Which Problem?”
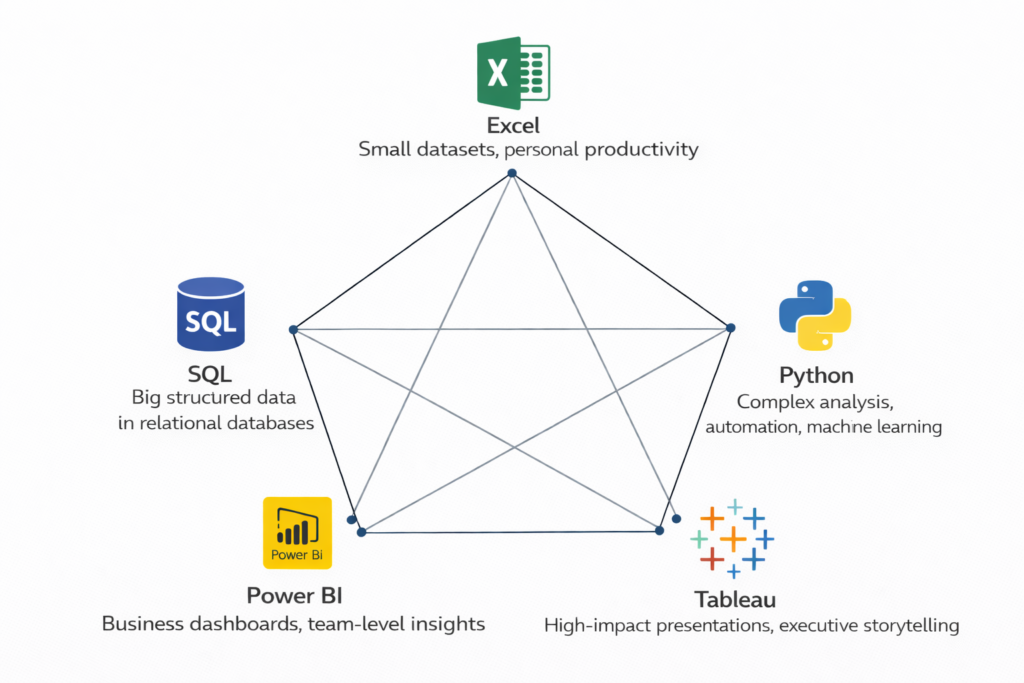
- Excel: Small datasets, personal productivity.
- SQL: Big structured data in relational databases.
- Python: Complex analysis, automation, machine learning.
- Power BI: Business dashboards, team-level insights.
- Tableau: High-impact presentations, executive storytelling.
Imagine a pentagon diagram, with each tool at one vertex, connected by lines showing overlapping use cases.
Conclusion
In 2025, the smartest analysts are not those who master a single tool, but those who know which tool to use for which problem. Excel, SQL, Python, Power BI, and Tableau are not competitors—they are partners in the data journey.
At CuriosityTech.in, we don’t just teach tools—we teach how to combine them. From live projects on sales analysis in Excel, to SQL querying workshops, to Python machine learning bootcamps, our learners gain multi-tool fluency. Whether you walk into our office at Gajanan Nagar, call +91-9860555369, or connect via LinkedIn (Curiosity Tech), you’ll always hear the same advice: “Don’t chase tools, build a toolbox.”