Introduction (Narrative + Hands-On Approach)
In 2025, Python has become the most versatile tool for data analysis, blending automation, visualization, and machine learning. Unlike Excel or SQL, Python allows you to clean, analyze, and visualize massive datasets with fewer limitations.

Imagine a mid-sized e-commerce business in Nagpur struggling to predict weekly sales trends. Using Python, a data analyst can:
- Load thousands of rows of order data
- Clean missing values automatically
- Calculate aggregates (total revenue, top-selling products)
- Prepare charts for stakeholders
- Feed the clean data into a predictive model
At CuriosityTech.in, our learners start Python with real datasets, making the transition from Excel & SQL seamless.
Step 1: Setting Up Python for Analysis
- Install Python: Use Anaconda distribution (includes Pandas, NumPy, Jupyter Notebook).
- Set up IDE: Jupyter Notebook or VS Code.
- Import Libraries:
import pandas as pd
import numpy as np
Step 2: Loading Data
Example: CSV of retail sales in Nagpur
data = pd.read_csv(“retail_sales_nagpur.csv”)
print(data.head())
- Purpose: Preview first 5 rows to understand structure.
Step 3: Exploring Data
- View columns: data.columns
- Check for missing values: data.isnull().sum()
- Basic statistics: data.describe()
Step 4: Cleaning Data with Pandas
- Remove duplicates:
data = data.drop_duplicates()
- Fill missing values:
data[‘Quantity’] = data[‘Quantity’].fillna(data[‘Quantity’].median())
- Standardize text:
data[‘City’] = data[‘City’].str.title()
Step 5: NumPy Basics for Data Analysis
NumPy is powerful for numerical operations:
- Create arrays:
import numpy as np
arr = np.array([10, 20, 30, 40])
- Calculate statistics:
np.mean(arr)
np.median(arr)
np.std(arr)
- Example: Convert Pandas column to NumPy array for faster computation:
quantities = data[‘Quantity’].to_numpy()
print(np.sum(quantities))
Step 6: Data Aggregation & Grouping
- Total sales by product:
total_sales = data.groupby(‘Product’)[‘Revenue’].sum().reset_index()
print(total_sales)
- Top 5 products by sales:
top_products = total_sales.sort_values(‘Revenue’, ascending=False).head(5)
print(top_products)
Step 7: Filtering Data
- Example: Orders from Nagpur in January 2025:
jan_orders = data[(data[‘City’] == ‘Nagpur’) & (data[‘Order_Date’] >= ‘2025-01-01’)]
- Combining multiple conditions helps slice datasets efficiently for analysis.
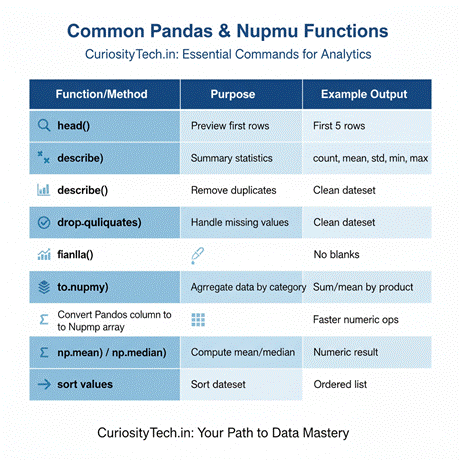
Common Pandas & NumPy Functions (Table)

| Function/Method | Purpose | Example Output |
| head() | Preview first rows | First 5 rows |
| describe() | Summary statistics | count, mean, std, min, max |
| drop_duplicates() | Remove duplicates | Clean dataset |
| fillna() | Handle missing values | No blanks |
| groupby() | Aggregate data by category | Sum/mean by product |
| to_numpy() | Convert Pandas column to NumPy array | Faster numeric ops |
| np.mean() / np.median() | Compute mean/median | Numeric result |
| sort_values() | Sort dataset | Ordered list |
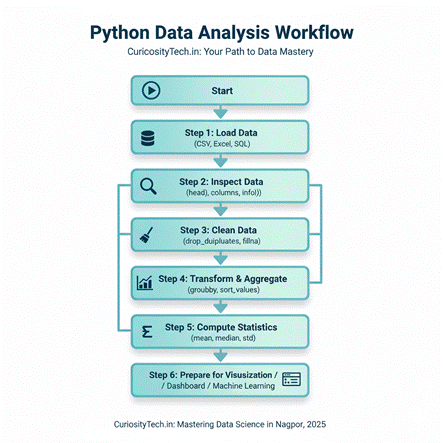
Python Data Analysis Workflow (Textual Diagram)

Start
│
├── Step 1: Load Data (CSV, Excel, SQL)
│
├── Step 2: Inspect Data (head(), columns, info())
│
├── Step 3: Clean Data (drop_duplicates, fillna)
│
├── Step 4: Transform & Aggregate (groupby, sort_values)
│
├── Step 5: Compute Statistics (mean, median, std)
│
└── Step 6: Prepare for Visualization / Dashboard / Machine Learning
Real-World Example (Hands-On Project)
Scenario: Retail chain in Nagpur wants to analyze weekend sales trends:
- Load sales CSV using Pandas.
- Clean missing product names and quantities.
- Filter weekend orders using datetime functions.
- Aggregate sales by product category using groupby.
- Sort and find top 5 selling categories.
Outcome: Python provides clean, summarized datasets ready for visualization in Power BI or Tableau.
Mistakes to Avoid
- Ignoring missing data → skewed results
- Using loops instead of vectorized operations → slower performance
- Not resetting index after groupby → misalignment in joins/plots
- Hardcoding column names → less reusable scripts
Tips to Master Python for Data Analysis
- Start small: practice on CSV files before moving to SQL or APIs.
- Learn Pandas & NumPy thoroughly—these are foundational for machine learning later.
- Combine Python with Excel → smoother transition for business analytics.
- Take real-world datasets from e-commerce, finance, or healthcare to build portfolio projects.
- At CuriosityTech.in, our Python bootcamps provide step-by-step exercises, live datasets, and mentor support in Nagpur.
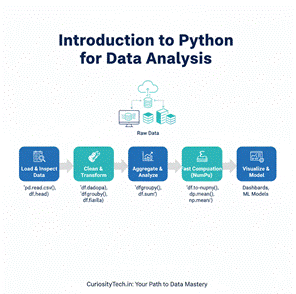
Infographic Description: “Python Data Analysis Pipeline”
- Stage 1: Load & Inspect Data (Pandas)
- Stage 2: Clean & Transform (dropna, fillna, string methods)
- Stage 3: Aggregate & Analyze (groupby, mean, sum)
- Stage 4: Convert to NumPy arrays for fast computation
- Stage 5: Prepare for Visualization / Dashboards / Machine Learning
Visualize as a linear flowchart with arrows showing data moving from raw CSV → clean dataset → aggregation → ready for visualization.
Conclusion
Python, combined with Pandas and NumPy, is essential for modern data analysts. It handles large datasets, automation, and advanced computation that Excel or SQL alone cannot manage efficiently.
At CuriosityTech.in, learners in Nagpur and beyond start with hands-on Python labs, progressing from cleaning data to building analysis-ready datasets, then feeding into dashboards or predictive models. Contact us via +91-9860555369 or contact@curiositytech.in to join practical Python sessions.

