
Introduction
Building your first machine learning model can be intimidating, but with Scikit-Learn in Python, beginners can learn efficiently while gaining practical, hands-on experience. In 2025, Scikit-Learn remains one of the most widely used ML libraries due to its simplicity, versatility, and integration with Python’s data ecosystem.
At curiositytech.in, Nagpur (1st Floor, Plot No 81, Wardha Rd, Gajanan Nagar), we guide learners through real-world projects, enabling them to understand the full ML workflow—from dataset exploration to model evaluation and insights.
This blog provides a complete, step-by-step guide to building your first ML model, with a practical project example, workflow diagrams, and tips to become proficient.
Section 1 – Understanding the ML Workflow
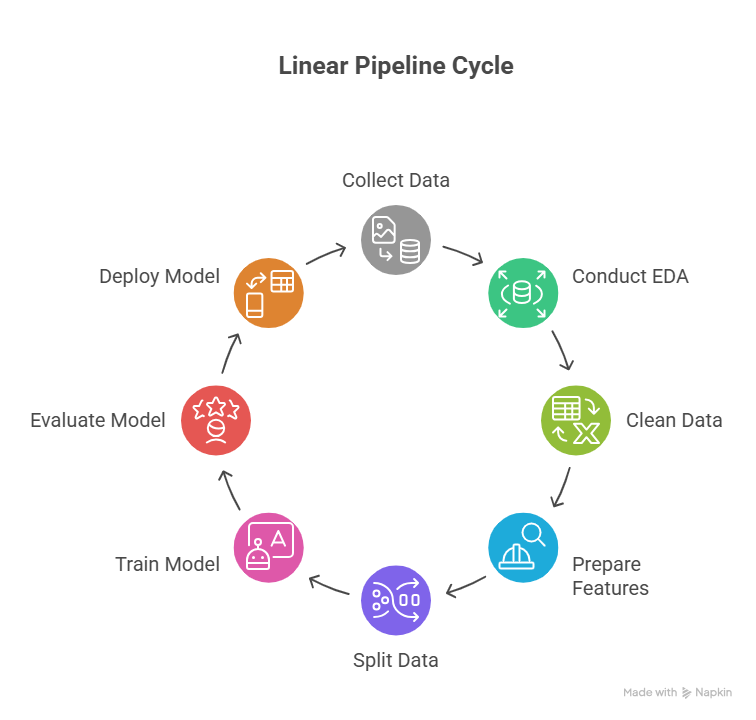
Before building a model, it’s important to understand the end-to-end ML workflow:
- Data Collection: Obtain a dataset relevant to the problem
- Exploratory Data Analysis (EDA): Understand patterns and relationships
- Data Cleaning & Preprocessing: Handle missing values, outliers, and encode categorical variables
- Feature Selection/Engineering: Choose relevant features that improve model performance
- Train-Test Split: Separate data into training and testing sets
- Model Selection & Training: Choose an algorithm and train it
- Evaluation: Assess performance using metrics
- Prediction & Deployment: Apply model to new data
Workflow Diagram Description:
Section 2 – Project Example: Predicting House Prices
Problem Statement: Predict house prices based on features such as size, bedrooms, age, and location.
Dataset:
- Features: Square_Feet, Bedrooms, Age, Location
- Target: Price
Section 3 – Step 1: Load and Inspect Data
import pandas as pd
df = pd.read_csv(‘house_prices.csv’)
print(df.head())
print(df.info())
print(df.describe())
Key Notes:
- Identify missing values, data types, and outliers
- Understand ranges and distributions
CuriosityTech Tip: Always visualize data using histograms or boxplots before modeling
Section 4 – Step 2: Data Preprocessing
- Handle Missing Values
df[‘Price’].fillna(df[‘Price’].mean(), inplace=True)
df.dropna(subset=[‘Square_Feet’,’Bedrooms’], inplace=True)
- Encode Categorical Variables (if any)
df = pd.get_dummies(df, columns=[‘Location’], drop_first=True)
- Feature Scaling (optional)
- Standardize numeric features for algorithms sensitive to scale
from sklearn.preprocessing import StandardScaler
scaler = StandardScaler()
df[[‘Square_Feet’,’Age’]] = scaler.fit_transform(df[[‘Square_Feet’,’Age’]])
Section 5 – Step 3: Split Data
from sklearn.model_selection import train_test_split
X = df.drop(‘Price’, axis=1)
y = df[‘Price’]
X_train, X_test, y_train, y_test = train_test_split(X, y, test_size=0.2, random_state=42)
Story Integration:
At CuriosityTech, learners split datasets to ensure models generalize well to unseen data, preventing overfitting.
Section 6 – Step 4: Model Selection & Training
Choosing Linear Regression for Beginners:
from sklearn.linear_model import LinearRegression
model = LinearRegression()
model.fit(X_train, y_train)
Conceptual Note:
- Linear Regression fits a line (or hyperplane) that minimizes prediction error
- This project teaches fundamental ML concepts, which can later be applied to more complex algorithms
Section 7 – Step 5: Model Evaluation
from sklearn.metrics import mean_squared_error, r2_score
y_pred = model.predict(X_test)
mse = mean_squared_error(y_test, y_pred)
r2 = r2_score(y_test, y_pred)
print(“Mean Squared Error:”, mse)
print(“R² Score:”, r2)
Interpreting Results:
- MSE: Measures average squared difference between predicted and actual values
- R²: Indicates how well the model explains variance in the data
CuriosityTech Insight: Learners are taught to visualize predictions vs actual values using Matplotlib or Seaborn for better interpretation
Section 8 – Step 6: Predict on New Data
new_house = pd.DataFrame({
‘Square_Feet’:[1500],
‘Bedrooms’:[3],
‘Age’:[10],
‘Location_Suburb’:[1],
‘Location_City’:[0]
})
predicted_price = model.predict(new_house)
print(“Predicted House Price:”, predicted_price)
Outcome: Students see direct application of ML model predictions in real-world scenarios
Section 9 – Tips to Master ML with Scikit-Learn
- Practice on different datasets: classification, regression, and clustering
- Learn train-test split, cross-validation, and hyperparameter tuning
- Visualize predictions and residuals for insights
- Build a portfolio of ML projects demonstrating workflow and results
- Apply project storytelling: explain problem → approach → results → business impact
CuriosityTech Tip: Our learners build complete ML pipelines, including preprocessing, modeling, evaluation, and reporting for their portfolios
Section 10 – Real-World Impact Story
A learner at curiositytech.in Nagpur applied this workflow to predict used car prices. By implementing a Linear Regression model and visualizing residuals, they discovered key features influencing price. The project became part of their portfolio for a data scientist role, showcasing hands-on, end-to-end ML implementation.
Conclusion
Building your first ML model requires understanding the workflow, preprocessing, model selection, evaluation, and prediction. Scikit-Learn simplifies this process, making Python the perfect language for beginners and professionals alike.
At curiositytech.in, we provide mentorship, real-world projects, and detailed guidance to ensure learners become confident, industry-ready data scientists in 2025. Contact +91-9860555369 or contact@curiositytech.in, and follow Instagram: CuriosityTech Park or LinkedIn: Curiosity Tech for updates and resources.

