Introduction
Effective monitoring is essential for maintaining cloud application performance, reliability, and security. Azure provides Azure Monitor and Log Analytics, a comprehensive monitoring and diagnostics suite for observing metrics, logs, and alerts across your cloud infrastructure.
At curiosity tech, learners gain hands-on expertise in monitoring cloud environments, analyzing telemetry data, and configuring actionable alerts to ensure production-grade observability.
1. What is Azure Monitor?
Definition:– Azure Monitor is a centralized platform that collects metrics and logs from Azure resources, applications, and on-premises environments, providing real-time insights into system performance and availability.
Key Capabilities:
- Metrics Monitoring: CPU, memory, storage, network, and custom metrics.
- Log Collection: Activity logs, diagnostic logs, and application logs.
- Alerts & Notifications: Trigger alerts based on thresholds or anomalies.
- Dashboards: Visualize data with custom charts, graphs, and tiles.
Diagram: Azure Monitor Architecture
2. Understanding Log Analytics
Definition:– Log Analytics is a tool within Azure Monitor that enables querying and analyzing log data using the Kusto Query Language (KQL). It helps engineers identify patterns, troubleshoot issues, and optimize performance.
Key Features:
- Collect data from multiple sources: Azure resources, on-prem servers, custom applications
- Execute powerful queries to extract insights
- Visualize results in workbooks or dashboards
- Integrate with Azure Sentinel for security monitoring
Example: KQL Query to Find CPU Utilization > 80%
Perf
where CounterName == “% Processor Time”
summarize AvgCPU = avg(CounterValue) by Computer
where AvgCPU > 80
3. Types of Data Collected
| Data Type | Description | Example Use Case |
| Metrics | Numeric measurements over time | CPU usage, memory, network bandwidth |
| Activity Logs | Records management operations and events | VM creation, policy changes |
| Diagnostic Logs | Resource-specific logs (App Service, SQL, Storage) | Request/response logs, errors |
| Application Insights | Application telemetry | Request rates, failures, performance |
4. Scenario-Based Example: Monitoring Web Application Performance
Scenario: A company hosts a web application on Azure App Service with backend Azure SQL Database. Engineers need to monitor performance, detect failures, and optimize resources.
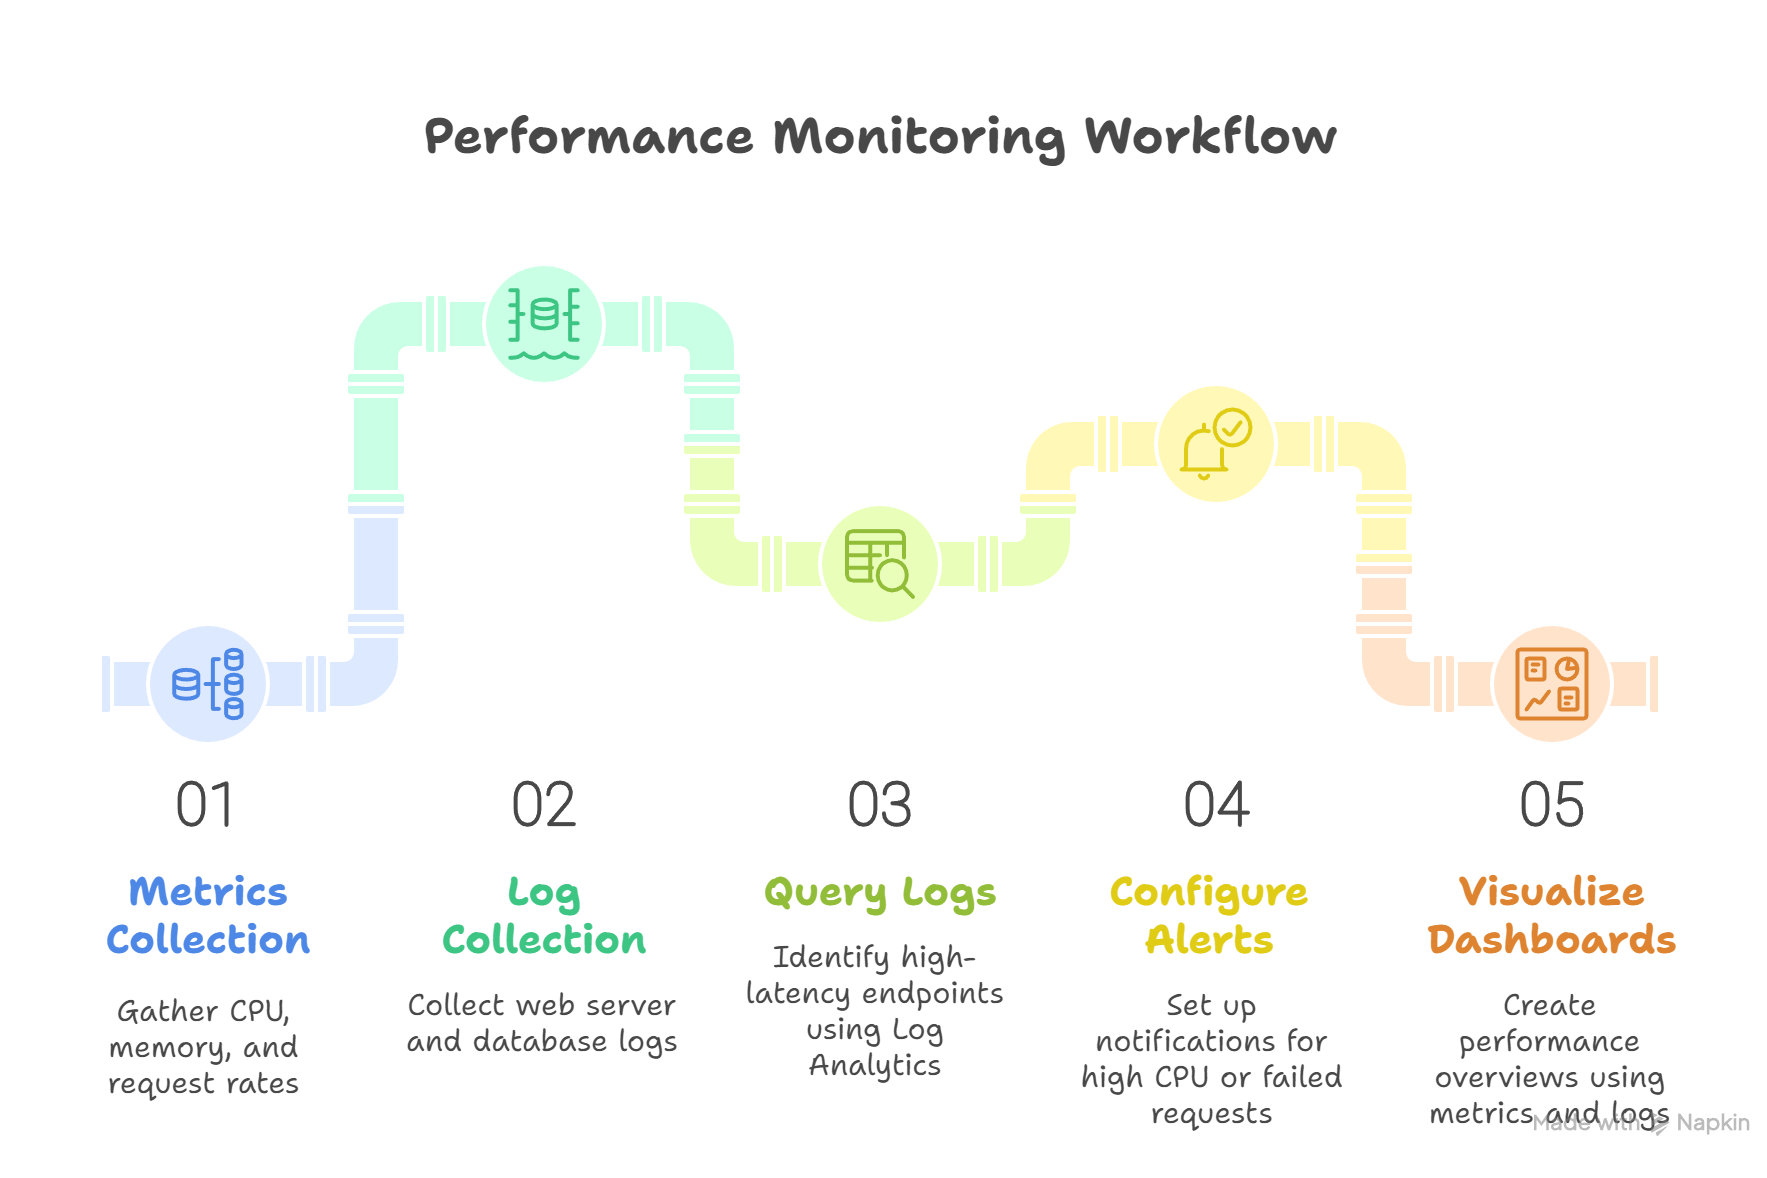
Workflow:
- Metrics Collection: CPU, memory, request rates, response times
- Log Collection: Web server logs, database query logs, error messages
- Query Logs: Identify endpoints with high latency using Log Analytics
- Configure Alerts: Trigger notifications when CPU > 80% or failed requests > 5%
- Visualize Dashboards: Combine metrics and log queries to create a performance overview
5. Hands-On: Setting Up Azure Monitor & Log Analytics
Step 1: Create Log Analytics Workspace
- Azure Portal → Create Resource → Log Analytics Workspace
- Provide workspace name, subscription, and region
2: Connect Azure Resources
- VM: Azure Monitor → Insights → Enable monitoring
- App Service: Diagnostic settings → Send logs to Log Analytics
3: Query Logs
- Navigate to workspace → Logs → Use KQL
- Example query to check failed requests in the last 24 hours:
AppRequests
where Timestamp > ago(24h)
where Success == “False”
summarize FailedRequests = count() by Url
Step 4: Configure Alerts
- Create alert rule based on query
- Define action group: Email, SMS, Webhook
Step 5: Build Dashboard
- Pin metrics charts and query results to a custom Azure Dashboard.
- Share with team for collaborative monitoring.
6. Advanced Features & Expert Tips
- Workbooks: Combine metrics, logs, and visualizations for executive reporting.
- Custom Metrics: Push application-specific metrics to Azure Monitor.
- Dynamic Thresholds: Alerts that adapt to normal behavior trends.
- Integration: Use Azure Monitor with Power BI or Teams for actionable insights.
- Proactive Monitoring: Implement synthetic transactions to detect performance issues before users notice.
At curiositytech.in, learners simulate real-world monitoring scenarios, configuring dashboards, alerts, and diagnostic logs for highly available, production-grade applications.
Conclusion
Azure Monitor and Log Analytics provide end-to-end observability of cloud environments, enabling engineers to detect issues, optimize performance, and ensure reliability. By mastering metrics, logs, alerts, and dashboards, engineers can proactively maintain cloud applications. Hands-on labs at curiositytech.in equip learners with the practical skills to implement enterprise-level monitoring and insights effectively.