In cloud environments, visibility is critical. On Day 12, we explore AWS CloudWatch and AWS CloudTrail, two core services that allow cloud engineers to monitor, log, and troubleshoot AWS resources effectively.
At Curiosity Tech, we emphasize that monitoring isn’t just about alerts—it’s about understanding system behavior, predicting failures, and optimizing performance.
1. Understanding AWS CloudWatch
AWS CloudWatch is a monitoring and observability service that provides metrics, logs, alarms, and dashboards for AWS resources and applications.
Key Features:
- Collects metrics (CPU, memory, disk usage, etc.)
- Aggregates logs from EC2, Lambda, RDS, and more
- Triggers alarms and notifications
- Provides custom dashboards for visualization
Analogy: Think of CloudWatch as the control room of a smart city, continuously tracking the health of every component, raising alerts, and visualizing performance trends.
2. Understanding AWS CloudTrail
AWS CloudTrail provides auditing and governance by recording all API calls and account activity in your AWS environment.
Key Features:
- Tracks who did what, when, and where
- Logs management and data events
- Supports integration with CloudWatch Logs for alerting
- Helps meet compliance and audit requirements
Analogy: CloudTrail is like a security camera for your cloud, capturing every action and providing accountability.
3. CloudWatch vs CloudTrail: Key Differences
| Feature | CloudWatch | CloudTrail |
| Purpose | Monitoring & observability | Auditing & governance |
| Data Type | Metrics, logs, events | API calls, user activity |
| Real-Time Alerts | Yes (alarms & notifications) | No, typically for auditing |
| Use Case | Performance monitoring, scaling | Security auditing, compliance |
| Integration | SNS, Lambda, Dashboards | S3, CloudWatch Logs, Athena |
Expert Tip: Beginners often confuse metrics with logs. Metrics are numerical measurements over time, while logs are detailed event records.
4. Core CloudWatch Components
| Component | Description | Example |
| Metrics | Numerical data about AWS resources | CPU utilization of EC2 instance |
| Alarms | Trigger notifications based on thresholds | CPU > 80% triggers SNS email |
| Logs | Detailed event records | Application error logs |
| Dashboards | Visual representation of metrics | EC2, Lambda, RDS in one view |
| Events / EventBridge | React to state changes or schedules | Trigger Lambda on S3 object upload |
5. Core CloudTrail Components
| Component | Description | Example |
| Trail | Records API calls across the AWS account | curiositytech-trail |
| Event Types | Management events (create, delete) | Data events (S3 object access) |
| Delivery | Logs delivered to S3 / CloudWatch | s3://curiositytech-cloudtrail-logs |
| Insights | Detect unusual API activity | High delete requests to S3 |
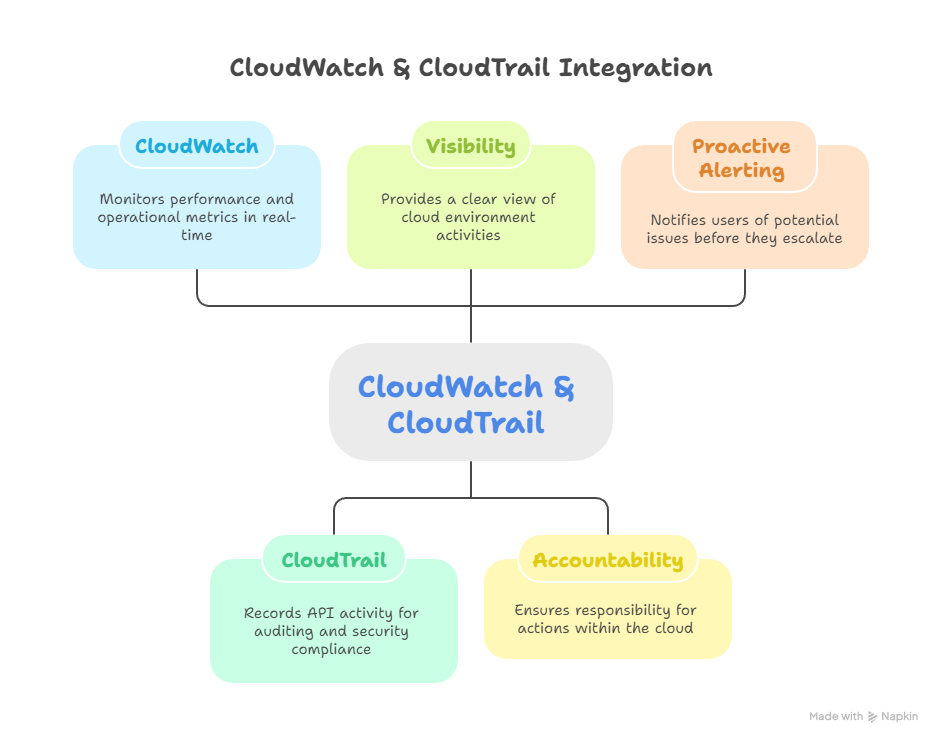
6. Workflow Diagram: CloudWatch & CloudTrail
Explanation:
- CloudWatch monitors performance and operational metrics in real-time.
- CloudTrail records API activity for auditing and security compliance.
- Together, they provide visibility, accountability, and proactive alerting.
7. Step-by-Step Lab: Monitoring EC2 with CloudWatch
1 – Enable CloudWatch Agent
- Install agent on EC2 instance (Linux / Windows)
- Configure metrics collection (CPU, memory, disk)
2 – Create CloudWatch Alarm
- Navigate to CloudWatch → Alarms → Create Alarm
- Select EC2 CPU utilization metric
- Set threshold: CPU > 70% for 5 minutes
- Configure SNS notification for alert delivery
3 – Visualize Metrics on Dashboard
- Create a custom dashboard
- Add EC2, Lambda, and RDS metrics
- Track trends over time
4 – Analyze Logs
- Access CloudWatch Logs → Filter errors or exceptions
- Trigger Lambda or SNS for automated responses
8. Step-by-Step Lab: Auditing with CloudTrail
1 – Create a Trail
- Navigate to CloudTrail → Trails → Create Trail
- Name: curiositytech-trail
- Storage: S3 bucket for logs
2 – Enable Logging
- Management events: Enabled
- Data events: Enable for S3 or Lambda if needed
3 – Monitor Logs
- Logs stored in S3 or sent to CloudWatch Logs
- Query with Athena to detect suspicious activity
Curiosity Tech Insight: Beginners often overlook CloudTrail, but auditing every API call is crucial for security and compliance in professional cloud environments.
9. Best Practices
| Practice | Reason |
| Enable CloudWatch agent on all EC2 instances | Collect detailed system-level metrics |
| Configure SNS notifications for alarms | Proactive incident response |
| Enable CloudTrail in all regions | Complete audit coverage |
| Integrate CloudTrail + CloudWatch Logs | Real-time alerting for suspicious API calls |
| Regularly analyze logs with Athena or QuickSight | Identify trends, errors, and security anomalies |
10. Common Beginner Mistakes
- Confusing CloudWatch metrics vs CloudTrail events
- Forgetting to enable CloudTrail in all regions → incomplete audit
- Not configuring alarms → missing critical incidents
- Ignoring log retention policies → loss of historical data
Expert Tip: At CuriosityTech.in, students practice real-time monitoring labs, combining CloudWatch alarms, dashboards, and CloudTrail event analysis to simulate production-ready monitoring setups.
11. Path to Expertise
- Begin by monitoring EC2 metrics and logs using CloudWatch.
- Create alarms and dashboards for visualization and notifications.
- Enable CloudTrail for auditing and track all API activity.
- Integrate CloudTrail logs with CloudWatch and Athena for advanced analytics.
- Explore automated remediation using Lambda and EventBridge.
At Curiosity Tech, learners gain hands-on experience designing end-to-end monitoring systems, preparing them for real-world AWS cloud operations and security compliance.
Conclusion
Monitoring and logging are critical for operational excellence and security in AWS. CloudWatch provides real-time performance insights, while CloudTrail ensures accountability and auditing. Mastering both services allows cloud engineers to maintain, optimize, and secure applications effectively.
Practical labs and mentorship at Curiosity Tech ensure learners gain both theoretical understanding and hands-on experience, enabling them to proactively monitor, troubleshoot, and secure AWS environments.