Introduction (Experimental Design + Business Insights)
Hypothesis testing and A/B testing are critical for data-driven decision-making in 2025. They allow businesses to validate assumptions, optimize strategies, and measure outcomes.
Imagine a Nagpur-based e-commerce company planning a marketing campaign. They have two email designs and want to determine which design increases click-through rates. Random guesses won’t work—A/B testing provides statistically valid answers.
At CuriosityTech.in, learners conduct hands-on hypothesis testing and A/B experiments, learning to derive actionable business insights from data.
Step 1: Understanding Hypothesis Testing
Key Concepts:
- Null Hypothesis (H0): Assumes no effect or difference
- Alternative Hypothesis (H1): Assumes an effect or difference exists
- Significance Level (α): Threshold probability to reject H0, commonly 0.05
- P-Value: Probability of observing data if H0 is true; small p-value → reject H0
- Test Statistic: Measures deviation from H0
Common Tests:
| Test Type | Purpose | Example Use Case |
| T-Test (Independent) | Compare means of two groups | Revenue from two marketing campaigns |
| Paired T-Test | Compare means of paired observations | Before vs After sales data |
| Chi-Square Test | Test relationship between categorical variables | Purchase decision by region |
| ANOVA | Compare means across multiple groups | Revenue across different stores |
| Z-Test | Large sample comparison | Click-through rates A/B testing |
Step 2: Conducting a T-Test in Python
from scipy.stats import ttest_ind
# Revenue from two campaigns
campaign_a = data[data[‘Campaign’]==’A’][‘Revenue’]
campaign_b = data[data[‘Campaign’]==’B’][‘Revenue’]
t_stat, p_val = ttest_ind(campaign_a, campaign_b)
print(“T-Statistic:”, t_stat, “P-Value:”, p_val)
Interpretation: If p_val < 0.05, reject H0 → campaign has significant effect
Step 3: Conducting A/B Testing
Definition: A/B testing compares two variants of a variable to determine which performs better.
Steps:
- Identify goal metric (e.g., click-through rate, revenue)
- Split users randomly into Group A and Group B
- Collect data for a predefined period
- Perform statistical test (T-Test or Z-Test)
- Make data-driven decision
Example:
| Group | Users | Clicks | Click-through Rate |
| A | 1000 | 120 | 12% |
| B | 950 | 130 | 13.7% |
- Apply Z-Test to check significance
from statsmodels.stats.proportion import proportions_ztest
clicks = np.array([120, 130])
users = np.array([1000, 950])
z_stat, p_val = proportions_ztest(clicks, users)
print(“Z-Statistic:”, z_stat, “P-Value:”, p_val)
- Small p-value → one variant significantly outperforms the other
Step 4: Applying in Excel
- T-Test: =T.TEST(array1, array2, 2, 2)
- Z-Test for proportions: Requires manual calculation using standard error formula:
Z = (p1 – p2) / sqrt(p*(1-p)*(1/n1 + 1/n2))
- Interpret results: Compare Z-value to critical Z for α=0.05
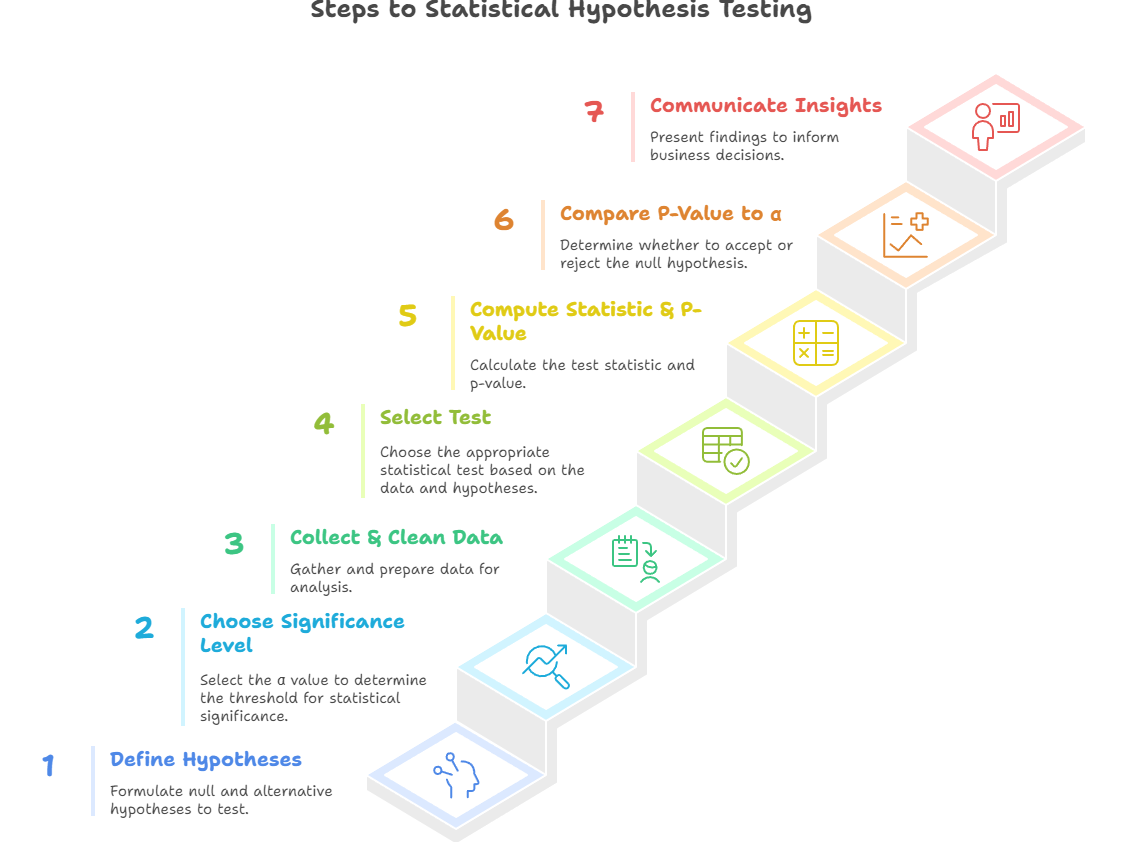
Step 5: Hypothesis Testing Workflow (Textual Flowchart)
Step 6: Real-World Scenario
Scenario:– Nagpur e-commerce marketing team tests two email campaigns:
- Group A receives design A, Group B receives design
- Goal: Increase click-through rates
- Perform T-Test or Z-Test to determine statistical significance
- Result: Campaign B statistically outperforms → adopt design B
Outcome: Company uses data-driven marketing strategies, improving ROI.
At CuriosityTech.in, learners simulate A/B tests on real datasets, analyzing conversion rates, revenue impact, and user behavior, preparing them for real corporate analytics projects.
Common Mistakes
- Small sample size → unreliable results
- Ignoring randomization → biased outcomes
- Running multiple tests without correction → false positives
- Misinterpreting p-value → incorrect conclusions
- Using inappropriate test type for data
Tips to Master Hypothesis & A/B Testing
- Always define clear hypotheses and metrics
- Ensure randomized samples
- Use Python, Excel, or SQL depending on dataset and scenario
- Visualize results with charts to communicate insights
- At CuriosityTech.in, learners practice multiple scenarios, building confidence in applying hypothesis testing to business decisions
Infographic Description: “Hypothesis Testing & A/B Testing Pipeline”

Conclusion
Hypothesis testing and A/B testing are powerful tools for validating assumptions and making data-driven business decisions. By mastering these methods, analysts can measure impact, optimize strategies, and reduce guesswork.
At CuriosityTech.in, learners in Nagpur gain hands-on experience conducting hypothesis tests and A/B experiments, preparing them for real-world analytics roles in 2025. Contact +91-9860555369 or contact@curiositytech.in to start mastering experimental design and testing.