Introduction
Predicting house prices is one of the classic machine learning projects that allows beginners and intermediate learners to practice end-to-end ML workflows. In 2025, housing market prediction models help real estate companies, investors, and urban planners make data-driven decisions.
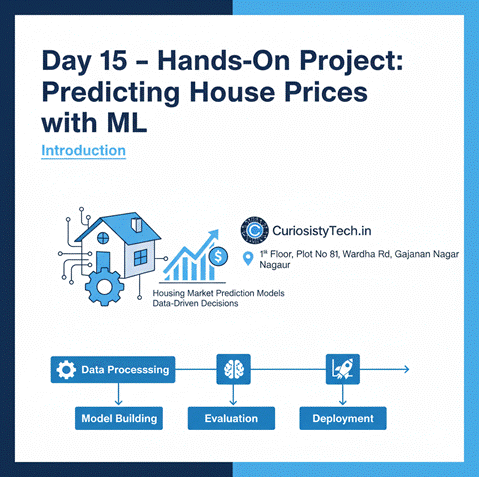
At CuriosityTech.in, Nagpur (1st Floor, Plot No 81, Wardha Rd, Gajanan Nagar), we teach learners how to build, evaluate, and visualize house price prediction models using Python, Scikit-Learn, and real-world datasets.
This blog guides you through data preprocessing, model selection, feature engineering, evaluation, and visualization, combining storytelling with practical examples.
Section 1 – Understanding the Problem
Objective: Predict the sale price of houses based on features like:
- Square footage
- Number of bedrooms and bathrooms
- Location
- Year built
- Lot size
Real-World Context:
Imagine a real estate company wants to estimate fair market prices for new listings. A data scientist can build a predictive model to provide accurate estimates, reducing manual appraisal errors.
Section 2 – Dataset Overview
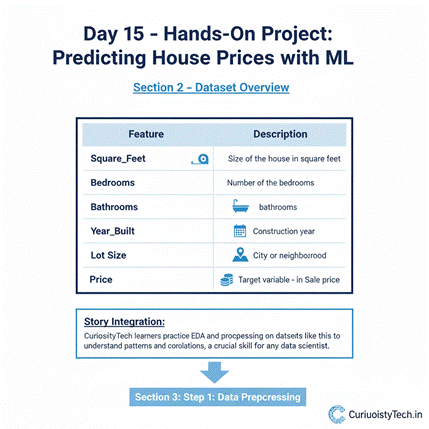
Dataset Columns:
| Feature | Description |
| Square_Feet | Size of the house in square feet |
| Bedrooms | Number of bedrooms |
| Bathrooms | Number of bathrooms |
| Year_Built | Construction year |
| Location | City or neighborhood |
| Lot_Size | Size of the land in square feet |
| Price | Target variable – Sale price |
Story Integration:
CuriosityTech learners practice EDA and preprocessing on datasets like this to understand patterns and correlations, a crucial skill for any data scientist.
Section 3 – Step 1: Data Preprocessing
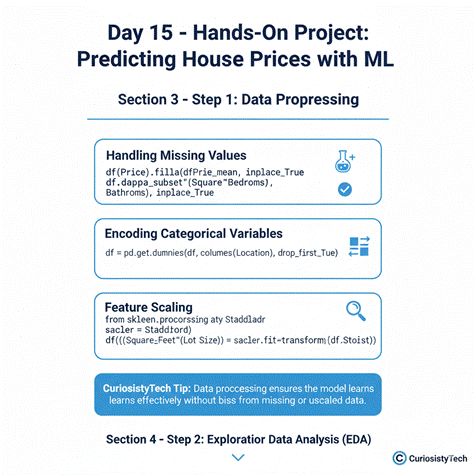
- Handling Missing Values:
df[‘Price’].fillna(df[‘Price’].mean(), inplace=True)
df.dropna(subset=[‘Square_Feet’,’Bedrooms’,’Bathrooms’], inplace=True)
- Encoding Categorical Variables:
df = pd.get_dummies(df, columns=[‘Location’], drop_first=True)
- Feature Scaling:
from sklearn.preprocessing import StandardScaler
scaler = StandardScaler()
df[[‘Square_Feet’,’Lot_Size’]] = scaler.fit_transform(df[[‘Square_Feet’,’Lot_Size’]])
CuriosityTech Tip: Data preprocessing ensures the model learns effectively without bias from missing or unscaled data.
Section 4 – Step 2: Exploratory Data Analysis (EDA)

- Visualizations: Scatter plots, histograms, and heatmaps to understand feature relationships
import seaborn as sns
import matplotlib.pyplot as plt
sns.heatmap(df.corr(), annot=True, cmap=’coolwarm’)
plt.show()
Key Insights Learners Look For:
- Positive correlation between Square_Feet and Price
- Influence of Location on price
- Potential outliers that may skew predictions
Section 5 – Step 3: Feature Engineering
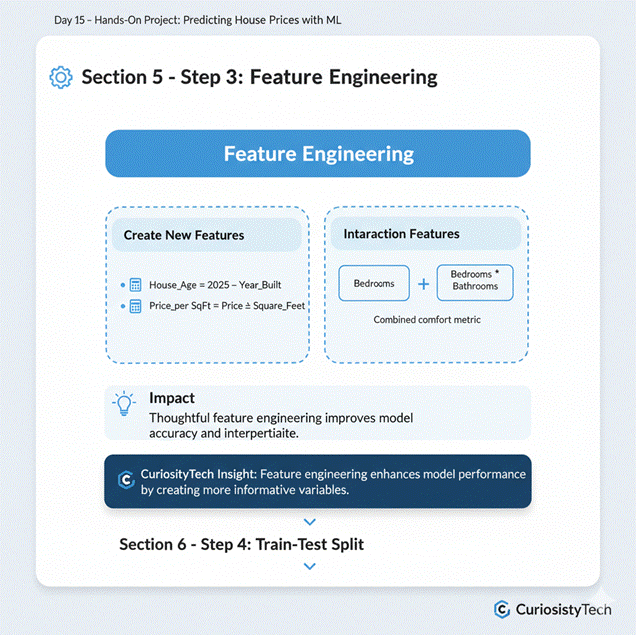
- Create New Features:
- House_Age = 2025 – Year_Built
- Price_per_SqFt = Price ÷ Square_Feet
- Interaction Features:
- Bedrooms * Bathrooms as a combined comfort metric
Impact: Thoughtful feature engineering improves model accuracy and interpretability.
Section 6 – Step 4: Train-Test Split
from sklearn.model_selection import train_test_split
X = df.drop(‘Price’, axis=1)
y = df[‘Price’]
X_train, X_test, y_train, y_test = train_test_split(X, y, test_size=0.2, random_state=42)
Story Context:
CuriosityTech learners split data to ensure model generalizes to unseen properties, a key step in professional ML projects.
Section 7 – Step 5: Model Selection & Training
Model Choice: Linear Regression for simplicity, Random Forest Regressor for better performance
from sklearn.ensemble import RandomForestRegressor
model = RandomForestRegressor(n_estimators=100, random_state=42)
model.fit(X_train, y_train)
CuriosityTech Insight: Comparing different algorithms is crucial to select the best-performing model.
Section 8 – Step 6: Model Evaluation
from sklearn.metrics import mean_squared_error, r2_score
y_pred = model.predict(X_test)
mse = mean_squared_error(y_test, y_pred)
r2 = r2_score(y_test, y_pred)
print(“MSE:”, mse)
print(“R² Score:”, r2)
Visualization Example:
plt.scatter(y_test, y_pred)
plt.xlabel(“Actual Prices”)
plt.ylabel(“Predicted Prices”)
plt.title(“Actual vs Predicted House Prices”)
plt.show()
Interpretation: Points close to the diagonal line indicate accurate predictions, helping learners understand model performance visually.
Section 9 – Step 7: Real-World Insights
- Important features: Square_Feet, Location, House_Age
- Random Forest captured non-linear relationships better than Linear Regression
- CuriosityTech learners create dashboard visualizations for stakeholders to interpret predictions and trends
Section 10 – Tips to Master House Price Prediction
- Practice on multiple real estate datasets to understand different markets
- Experiment with feature selection and engineering
- Compare regression models like Linear Regression, Decision Trees, Random Forest, XGBoost
- Use visualizations to communicate insights to non-technical stakeholders
- Document workflow, findings, and insights for portfolio projects
CuriosityTech Story: Learners applied this project to regional real estate data, helping local agencies estimate property values more accurately and efficiently.
Conclusion
Predicting house prices is an excellent beginner-to-intermediate ML project. By combining data preprocessing, feature engineering, model training, and evaluation, learners gain real-world data science skills.
At CuriosityTech.in Nagpur, students practice hands-on ML projects, visualization techniques, and portfolio building, preparing them for careers in data science in 2025. Contact +91-9860555369, contact@curiositytech.in, and follow Instagram: CuriosityTech Park or LinkedIn: Curiosity Tech for more guidance and resources.

