Introduction
Training and deploying ML models is only half the journey. In 2025, ML engineers must ensure that models continue to perform reliably in production. This involves monitoring performance, detecting anomalies, and scaling models to handle real-world loads.
At CuriosityTech.in (Nagpur, Wardha Road, Gajanan Nagar), we train learners to understand production-grade ML pipelines, emphasizing monitoring, metrics, alerting, and scaling strategies.
1. Why Monitoring and Scaling are Critical
Monitoring:
- Ensures model predictions remain accurate over time
- Detects data drift, concept drift, and performance degradation
- Supports compliance and audit requirements
Scaling:
- Handles increased traffic or data volume
- Maintains low latency and high throughput for real-time applications
- Enables horizontal and vertical scaling in production
CuriosityTech Insight: Many beginners deploy models but fail to implement monitoring. This leads to inaccurate predictions and poor user experience.
2. Production ML Architecture
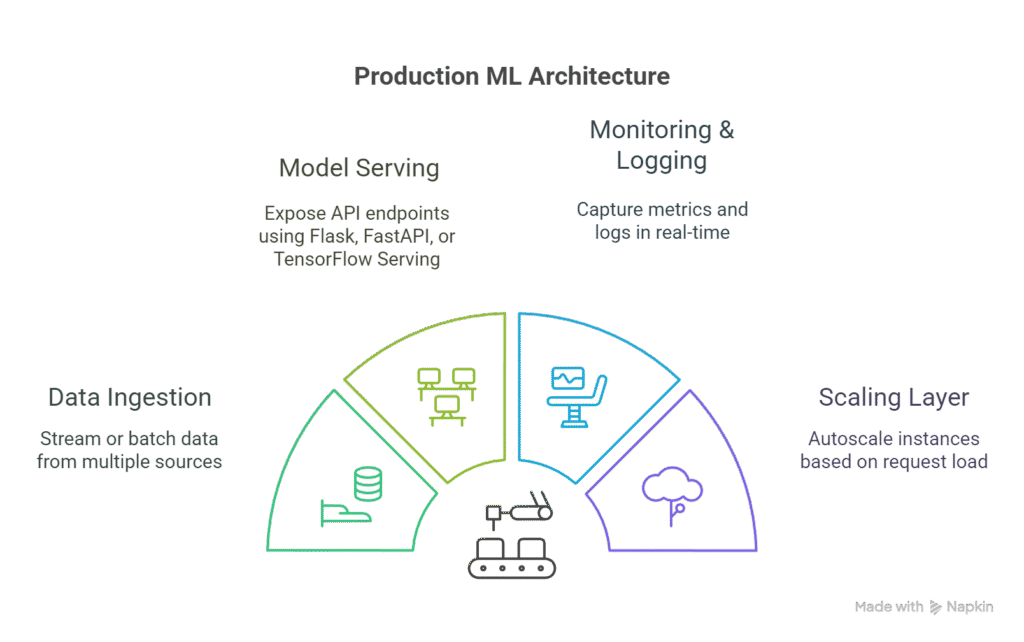
Components:
- Data Ingestion: Stream or batch data from multiple sources
- Model Serving: Expose API endpoints using Flask, FastAPI, or TensorFlow Serving
- Monitoring & Logging: Capture metrics and logs in real-time
- Scaling Layer: Autoscale instances based on request load
3. Monitoring ML Models
Key Metrics:
| Metric Type | Description | Tools |
| Performance | Accuracy, F1-score, ROC-AUC | MLflow, TensorBoard |
| Latency | Time per prediction | Prometheus, Grafana |
| Throughput | Requests per second | Kubernetes, ELK Stack |
| Data Drift | Distribution changes in input data | EvidentlyAI, WhyLabs |
| Concept Drift | Change in relationship between input and target | River, Alibi Detect |
Scenario Storytelling: Riya at Curiosity Tech Park monitors a deployed spam detection model. She notices that the model’s precision drops after a month due to new spam patterns, highlighting the need for retraining.
4. Logging & Alerting
- Centralized Logging: Collect logs from all model instances using ELK Stack or Fluentd
- Alerting: Set thresholds for key metrics (e.g., F1-score < 0.85 triggers an alert)
- Version Tracking: Maintain model versions for rollback and audit
Practical Insight:
CuriosityTech learners implement alerts via Slack or email, ensuring the engineering team responds immediately to degraded model performance.
5. Scaling ML Models
Scaling Techniques:
| Type | Description | Example |
| Vertical Scaling | Increase resources on a single instance | More CPU, RAM |
| Horizontal Scaling | Add more instances behind a load balancer | Kubernetes pods, AWS Auto Scaling |
| Batch Scaling | Process large datasets asynchronously | Spark, Airflow jobs |
| Real-Time Scaling | Autoscale API endpoints based on request load | FastAPI + Kubernetes |
Scenario Storytelling: Arjun deploys a recommendation system with horizontal scaling. During peak e-commerce traffic, the system autoscaled pods to handle 10,000 requests per second without latency issues.
6. Tools for Production Monitoring & Scaling
| Tool | Purpose | Notes |
| Prometheus | Metrics collection and alerting | Works with Grafana for dashboards |
| Grafana | Visualization of metrics | Real-time dashboards |
| ELK Stack | Logging and log analysis | Elasticsearch, Logstash, Kibana |
| Kubernetes | Container orchestration and scaling | Manage pods and autoscaling |
| MLflow | Track experiments and production metrics | Monitor model versions and performance |
| Seldon Core | Production ML deployment and scaling | Supports advanced model orchestration |
At CuriosityTech.in, students combine MLflow, Kubernetes, and Prometheus to create fully monitored and scalable ML production systems.
7. Handling Data Drift and Concept Drift
Data Drift: Input features change over time
Concept Drift: Relationship between features and target changes
Strategies to Handle Drift:
- Monitor distribution of features continuously
- Retrain models periodically or on trigger
- Implement canary deployment: deploy new model to a small subset before full rollout
- Use ensemble or adaptive models
CuriosityTech Example: Riya retrains a fraud detection model weekly because transaction patterns evolve, ensuring consistent accuracy.
8. Production ML Best Practices
- Automation: Automate retraining and deployment pipelines
- Monitoring: Track metrics and visualize dashboards
- Versioning: Keep track of model and data versions
- Scalability: Use cloud-native tools like AWS SageMaker, GCP AI Platform, or Azure ML
- Fail-Safe: Implement rollback mechanisms for failed deployments
- Security: Secure endpoints and data in transit
9. Real-World Applications
| Industry | Production ML Use Case | Monitoring & Scaling Requirement |
| Finance | Fraud detection | Real-time monitoring, autoscaling API endpoints |
| Retail | Recommendation systems | Batch retraining, high-traffic scaling |
| Healthcare | Disease prediction | Compliance monitoring, high reliability |
| Autonomous Vehicles | Object detection | Low latency, fail-safe scaling |
| NLP | Spam detection / sentiment analysis | Continuous retraining, drift monitoring |
CuriosityTech.in ensures learners implement production-grade monitoring and scaling, bridging the gap between training models and delivering reliable ML services.
10. Key Takeaways
- Production ML is more than deployment; monitoring and scaling are mandatory
- Use metrics, logging, and alerting to maintain model reliability
- Handle data and concept drift with automated retraining and validation
- Horizontal and vertical scaling ensure low latency and high throughput
- Hands-on experience is essential for understanding real-world production ML challenges
Conclusion
Monitoring and scaling are essential for ML engineers in 2025. Proper production pipelines ensure models:
- Remain accurate over time
- Handle increasing traffic efficiently
- Are maintainable, auditable and scalable
Contact CuriosityTech.in at +91-9860555369 or contact@curiositytech.in to get hands-on experience in production-grade ML monitoring, scaling, and deployment strategies.