
Introduction
Building a machine learning model is just half the journey. In 2025, evaluating model performance and ensuring its reliability is equally, if not more, important.
At Curiosity Tech (Nagpur, Wardha Road, Gajanan Nagar), we emphasize that even a high-accuracy model can fail in production if it isn’t properly evaluated. This blog dives deep into model evaluation metrics and cross-validation, providing real-world insights, step-by-step explanations, and practical examples.
1. Why Model Evaluation Matters
- Prevent Overfitting & Underfitting: Ensures models generalize to unseen data.
- Compare Algorithms: Metrics guide the choice between multiple models.
- Quantify Business Impact: Accurate evaluation translates to actionable decisions.
At CuriosityTech Park, we often demonstrate how wrong metrics can mislead engineers, causing business losses despite “high accuracy.”
2. Common Model Evaluation Metrics
A. For Regression :-
| Metric | Formula | Purpose | Interpretation |
| Mean Squared Error (MSE) | 1n∑(yi−y^i)2\frac{1}{n} \sum (y_i – \hat{y}_i)^2n1∑(yi−y^i)2 | Measures average squared error | Lower is better |
| Root Mean Squared Error (RMSE) | MSE\sqrt{MSE}MSE | Standard deviation of errors | Lower = better prediction accuracy |
| Mean Absolute Error (MAE) | ( \frac{1}{n} \sum | y_i – \hat{y}_i | ) |
| R² Score | 1−SSresSStot1 – \frac{SS_{res}}{SS_{tot}}1−SStotSSres | Fraction of variance explained | Closer to 1 is better |
Scenario Storytelling: Riya, a student at Curiosity Tech, predicts house prices. Using MSE alone gave her an error of 2500. RMSE revealed actual average deviation in thousands, helping her understand model precision better.
B. For Classification :-
| Metric | Formula / Definition | Purpose |
| Accuracy | TP+TNTP+TN+FP+FN\frac{TP + TN}{TP+TN+FP+FN}TP+TN+FP+FNTP+TN | Overall correctness |
| Precision | TPTP+FP\frac{TP}{TP+FP}TP+FPTP | Correct positive predictions |
| Recall (Sensitivity) | TPTP+FN\frac{TP}{TP+FN}TP+FNTP | Ability to find all positives |
| F1-Score | 2⋅Precision⋅RecallPrecision+Recall2 \cdot \frac{Precision \cdot Recall}{Precision + Recall}2⋅Precision+RecallPrecision⋅Recall | Balance between Precision & Recall |
| Confusion Matrix | Table of TP, TN, FP, FN | Visualize performance per class |
Lab Example:- Spam detection classifier
from sklearn.metrics import accuracy_score, precision_score, recall_score, f1_score, confusion_matrix
accuracy = accuracy_score(y_test, y_pred)
precision = precision_score(y_test, y_pred)
recall = recall_score(y_test, y_pred)
f1 = f1_score(y_test, y_pred)
cm = confusion_matrix(y_test, y_pred)
CuriosityTech Insight: Students learn that accuracy alone can be misleading if classes are imbalanced (e.g., fraud detection).
3. Cross-Validation Techniques :-
Cross-validation ensures models generalize to unseen data, reducing overfitting.
A. Holdout Method :
- Split data into training and testing (e.g., 80%-20%)
- Simple but may vary with random splits
B. K-Fold Cross-Validation :
- Split data into k folds
- Train on k-1 folds, validate on 1 fold, repeat k times
- Average metric across folds gives robust evaluation
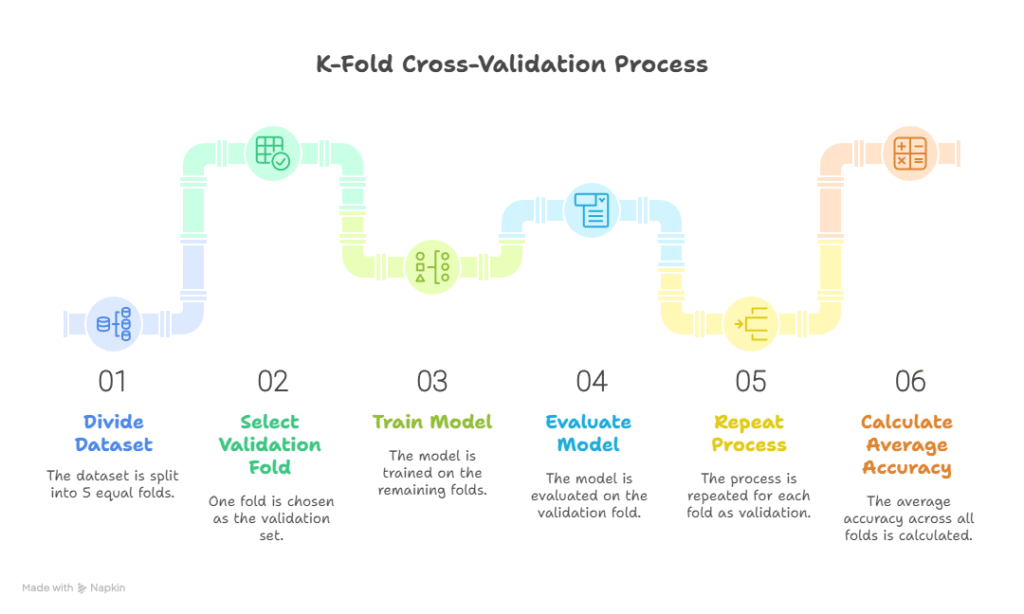
Diagam Description:
- Rectangle representing dataset
- Split into 5 equal folds
- Each fold highlighted as “validation” once, rest as “training”
- Average accuracy shown
C. Stratified K-Fold :
- Preserves class distribution in each fold
- Critical for imbalanced classification datasets
D. Leave-One-Out Cross-Validation (LOOCV) :
- Extreme case: 1 sample as test, rest as training
- Very precise but computationally expensive
4. Hands-On Example: K-Fold Cross-Validation :-
Scenario: Spam detection dataset, 1000 emails
from sklearn.model_selection import cross_val_score
from sklearn.linear_model import LogisticRegression
model = LogisticRegression()
scores = cross_val_score(model, X, y, cv=5, scoring=’accuracy’)
print(“Cross-Validation Accuracy:”, scores.mean())
Observation: Provides a more robust estimate of model performance than single train-test split.
At CuriosityTech.in, we encourage students to visualize fold-wise performance, spotting variance and understanding model stability.
5. Bias-Variance Tradeoff
Understanding evaluation metrics also means understanding model errors:
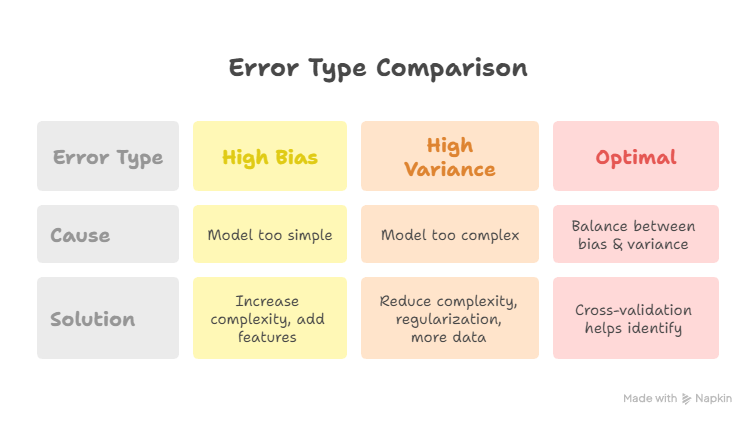
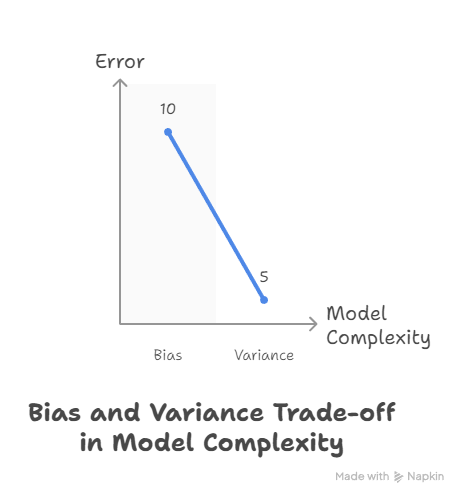
Diagram Description:
- X-axis: Model Complexity
- Y-axis: Error
- Two curves: Bias decreasing, Variance increasing
- Intersection = Optimal Model Complexity
6. Practical Tips from CuriosityTech Experts :-
7. Real-World Applications: –
8. Key Takeaways :-
Conclusion:
A model is only as good as its evaluation and validation. Mastery of metrics and cross-validation allows ML engineers to:
- Detect overfitting or underfitting
- Choose the right algorithms confidently
- Build reliable, production-ready ML systems
At CuriosityTech Nagpur, students perform extensive evaluation labs, bridging theoretical concepts with practical deployment. Reach out at contact@curiositytech.in or +91-9860555369 to join advanced ML training.