Introduction (Error-Analysis & Best Practices Style)
Even experienced analysts make mistakes—but understanding common pitfalls is essential to improve accuracy and credibility.
Imagine a Nagpur-based retail company analyzing sales data. A small mistake in Excel formulas, SQL queries, or Python scripts could mislead management, affect inventory decisions, or misrepresent performance. Identifying and avoiding these mistakes ensures data-driven decisions are reliable and actionable.
At curiositytech.in, learners are trained not just to analyze data, but to anticipate errors, implement checks, and adopt best practices, preparing them for real-world corporate analytics challenges.
Step 1: Categorizing Common Mistakes
- Data Mistakes:-
- Missing or inconsistent data
- Incorrect data types
- Duplicate records
- Outliers not identified
- Tool & Formula Mistakes:-
- Wrong Excel formulas or aggregation functions
- SQL query errors (joins, filters, groupings)
- Python syntax or library misuse
- Analysis Mistakes:-
- Misinterpretation of results
- Ignoring statistical significance
- Overfitting predictive models
- Choosing inappropriate visualization
- Communication Mistakes:-
- Overloading dashboards with too much information
- Using confusing charts or colors
- Failing to highlight actionable insights
- Ignoring audience requirements
Step 2: Examples & Preventive Strategies
| Mistake Type | Example | Consequence | How to Avoid |
| Missing Data | Excel missing revenue values | Skewed total revenue | Perform data validation and cleaning |
| Duplicate Records | SQL table has repeated order IDs | Inflated counts | Use DISTINCT and remove duplicates |
| Wrong Formula | Excel sum formula using incorrect range | Incorrect totals | Double-check ranges; use pivot tables |
| Incorrect Join | SQL INNER JOIN drops unmatched rows | Missing critical data | Verify join logic; test with sample datasets |
| Misinterpreting Correlation | Mistaking correlation for causation | Wrong business recommendation | Apply statistical reasoning; check domain knowledge |
| Overcomplicated Dashboard | Too many charts & KPIs | Stakeholders confused; insights lost | Focus on key metrics; use storytelling principles |
| Ignoring Outliers | Python mean calculation without removing outliers | Results skewed; misinterpret trends | Visualize with boxplots; consider winsorization |
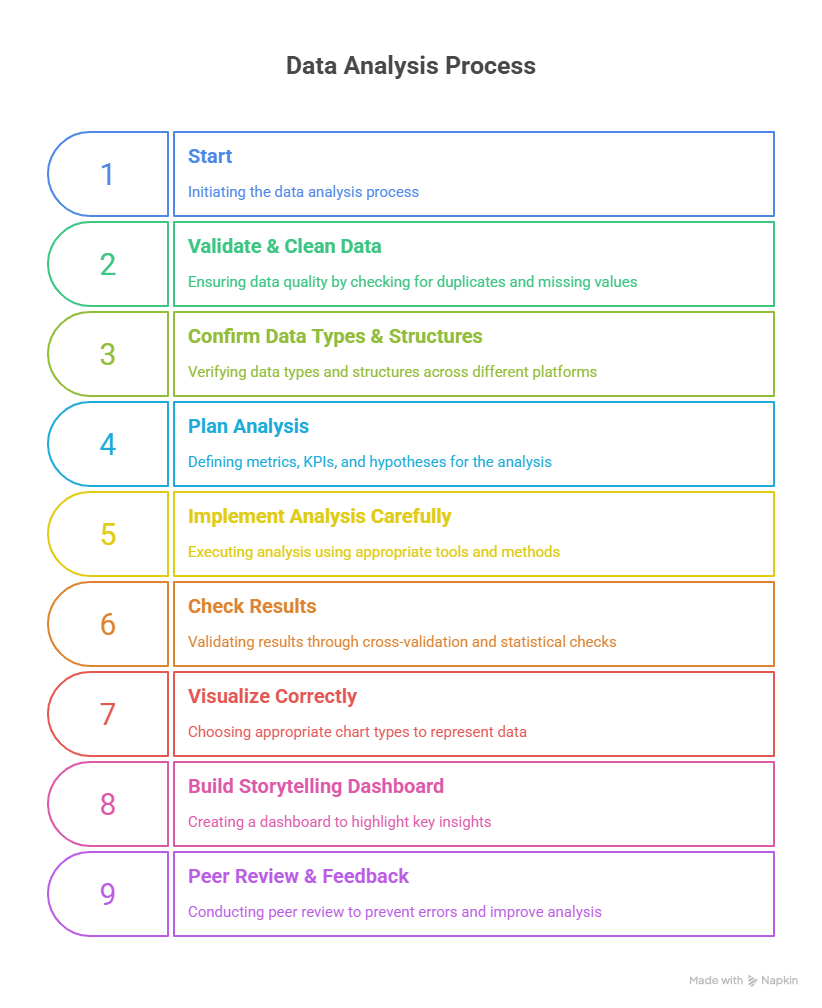
Step 3: Error-Proof Workflow
Step 4: Real-World Scenario
Scenario: Nagpur retail chain wants monthly sales insights.
- Analyst imports sales CSV into Excel but misses duplicate orders → revenue inflated
- SQL query joins Orders and Products incorrectly → some product sales missing
- Python script calculates average revenue but ignores outliers → misleading trend
- Dashboard overloaded with charts → management struggles to focus on key KPIs
Solution:
- Remove duplicates using SQL DISTINCT or Excel Remove Duplicates
- Validate joins using sample data
- Handle outliers using IQR or visualization
- Simplify dashboard, focus on top 3 KPIs, and add interactive filters
Outcome: Accurate, clean, and actionable insights ready for management decisions.
Step 5: Tips to Avoid Analyst Mistakes
- Always clean and validate data before analysis
- Use version control for datasets and scripts
- Cross-check formulas, queries, and scripts
- Visualize data to detect anomalies and outliers
- Tailor insights to audience needs
- Document steps for reproducibility
- Apply peer review to detect unnoticed errors
- At curiositytech.in, learners practice error-proof analytics workflows, gaining confidence in producing accurate, professional reports
Step 6: Infographic Description – “Common Analyst Mistakes & Solutions Pipeline”
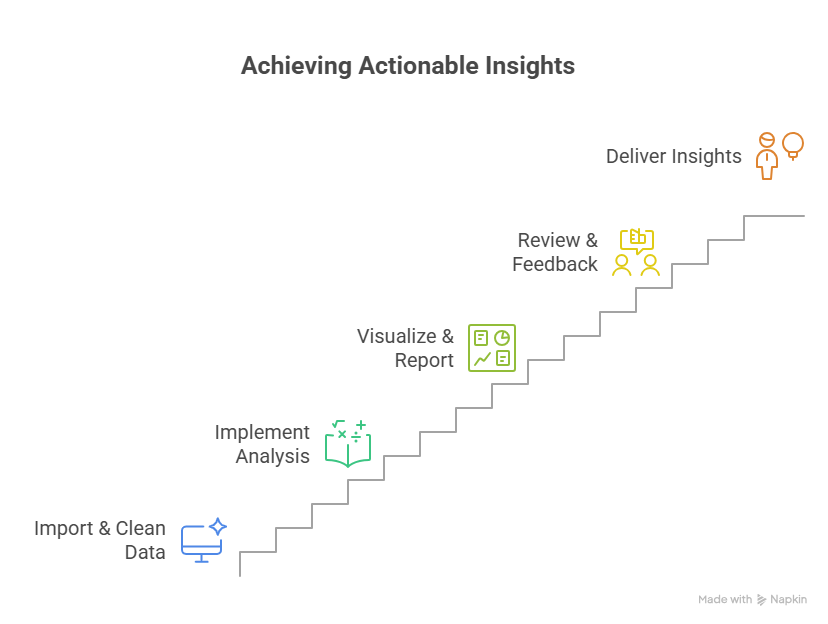
Visualize as a feedback loop, showing how each stage prevents downstream mistakes and ensures accurate analysis.
Conclusion
Understanding common data analyst mistakes is critical for accuracy, credibility, and business impact. By adopting best practices, validating data, and carefully implementing analysis, analysts can deliver reliable insights and build trust with stakeholders.
At curiositytech.in, learners in Nagpur are trained to anticipate errors, implement preventive measures, and produce professional analytics reports, ensuring they excel in real-world data analyst roles. Contact +91-9860555369 or contact@curiositytech.in to start learning error-proof analytics workflows for 2025.