Introduction (Hands-On Tutorial Style)
Imagine you are a data analyst in a retail company in Nagpur and you’ve been given three Excel sheets—Orders, Customers, and Products. Your manager asks:
“Which products are selling the most in Nagpur last quarter?”
This is a classic scenario where SQL shines. SQL (Structured Query Language) is the language of databases, used to extract, filter, and combine data efficiently. In 2025, knowing SQL is non-negotiable for any data analyst, whether you work with MySQL, PostgreSQL, or cloud databases like BigQuery.
At CuriosityTech.in, our students start with basic SQL queries and progressively work on complex joins and filters, mimicking real business scenarios.
SQL Basics: Step-by-Step
1. SELECT Statements – Fetching Data
SELECT Customer_Name, Order_Date, Total_Amount
FROM Orders;
- Purpose: Retrieve specific columns from a table.
- Example: See all customer orders in Nagpur for January 2025.
2. WHERE Clauses – Filtering Data
SELECT Customer_Name, Total_Amount
FROM Orders
WHERE City = ‘Nagpur’ AND Order_Date >= ‘2025-01-01’;
- Purpose: Narrow results based on conditions.
- Operators: =, >, <, >=, <=, BETWEEN, LIKE, IN
- Example: Filter orders greater than ₹5,000.
3. Aggregate Functions – Summarizing Data
SELECT Product_ID, SUM(Quantity) AS Total_Quantity
FROM Orders
GROUP BY Product_ID
ORDER BY Total_Quantity DESC;
- Purpose: Summarize and group data for insights.
- Common Functions: SUM(), COUNT(), AVG(), MAX(), MIN()
4. Joins – Combining Tables
| Join Type | Description | Example Use Case |
| INNER JOIN | Only matching rows from both tables | Orders & Customers for customers who made purchases |
| LEFT JOIN | All rows from left table, matched rows from right | List all customers and their orders (even if none) |
| RIGHT JOIN | All rows from right table, matched rows from left | List all products and any orders they had |
| FULL OUTER JOIN | All rows from both tables | Comprehensive dataset of customers and products |
Example:
SELECT Customers.Customer_Name, Orders.Total_Amount
FROM Customers
INNER JOIN Orders
ON Customers.Customer_ID = Orders.Customer_ID
WHERE Orders.City = ‘Nagpur’;
5. Filtering with Joins
- Combine multiple conditions to extract meaningful insights.
- Example: Top 5 products purchased in Nagpur in January 2025.
Hierarchical Querying Workflow (Textual Diagram)
Real-World Scenario (Practice Lab)
Scenario: A café in Nagpur tracks daily orders:
- Tables: Customers, Orders, Menu.
- Task: Find the top 3 menu items sold on weekends.
Steps:
- Identify tables & columns.
- Use JOIN to combine Orders and Menu.
- Apply WHERE to filter weekends.
- Aggregate with SUM().
- Sort using ORDER BY to get top 3 items.
This mirrors hands-on exercises at CuriosityTech.in, where learners practice SQL queries on live datasets, building confidence for real business tasks.
Common Mistakes in SQL & How to Avoid Them
- Using SELECT * excessively → Slows queries, exposes sensitive data.
- Not understanding join types → Leads to missing or duplicated records.
- Ignoring NULLs → Can distort aggregations.
- Hardcoding filters → Less reusable queries.
- Skipping documentation → Future maintenance becomes difficult.
Tips to Become an SQL Expert in 2025
- Start with SELECT, WHERE, GROUP BY → build a foundation.
- Practice joins on real datasets (Customers, Orders, Products).
- Learn subqueries and window functions for advanced analytics.
- Connect SQL outputs to Excel, Power BI, Tableau for visualization.
- Work on projects like sales analysis, churn prediction, and inventory reports.
At CuriosityTech Park, Gajanan Nagar, Nagpur, our SQL bootcamps guide students from basics to advanced querying, with real datasets. Participants often share results via LinkedIn (Curiosity Tech) and get hands-on experience with filtering, joining, and aggregation for practical projects.
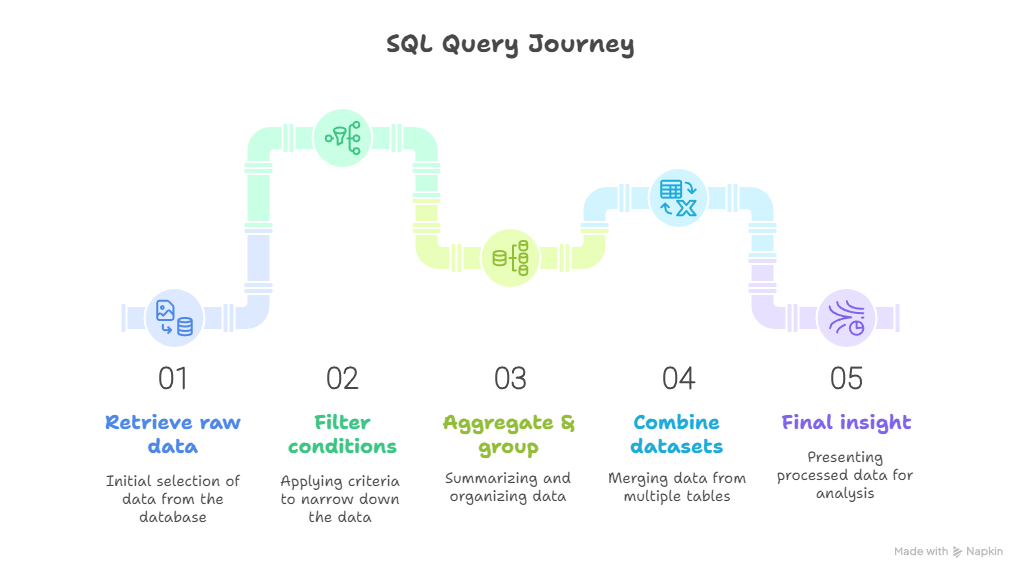
Infographic Description: “SQL Query Journey”
- Stage 1: Retrieve raw data (SELECT)
- Stage 2: Filter conditions (WHERE)
- Stage 3: Aggregate & group (SUM, COUNT, GROUP BY)
- Stage 4: Combine datasets (JOINs)
- Stage 5: Final insight for dashboards & reporting
Conclusion
SQL is the backbone of data analysis in 2025. Mastering queries, joins, and filtering not only makes you efficient but also gives you the ability to extract actionable insights from raw data.
At CuriosityTech.in, beginners to advanced learners follow a hands-on approach, connecting SQL outputs to dashboards and Python scripts. Visit us at Plot No 81, Wardha Rd, Gajanan Nagar, Nagpur, email contact@curiositytech.in, or call +91-9860555369 to start building your SQL expertise today.