
Introduction (Storytelling + Executive Reporting)
Imagine being a data analyst at a retail chain in Nagpur. Your CEO walks into the office and asks:
“Which products drove revenue during the festive season, and which regions underperformed?”
Raw numbers are overwhelming. Excel pivot tables and Power BI dashboards help, but Tableau excels in storytelling. It transforms complex data into interactive visual reports that engage executives and stakeholders, making insights easier to grasp.
At curiositytech.in, learners practice Tableau through real-world projects, analyzing sales, marketing campaigns, and customer trends, gaining the confidence to create reports that tell a story.
Step 1: Setting Up Tableau
- Install Tableau Desktop (trial version or licensed)
- Open Tableau and connect to data sources:
- Excel files
- CSV files
- SQL databases
- Google Sheets
- Preview data and check for consistency
Example: Connect a retail sales Excel dataset containing Product, Region, Sales, and Order Date.
Step 2: Creating Worksheets
- Drag and drop fields to Rows and Columns
- Use Measures for numeric values (e.g., Revenue, Quantity)
- Use Dimensions for categories (e.g., Product, Region)
- Apply filters to focus on relevant data
- Customize colors, labels, and tooltips to improve clarity
Step 3: Using Calculated Fields
Calculated fields allow dynamic metrics for reporting:
- Profit Margin: [Profit] / [Revenue]
- High Sales Indicator: IF [Revenue] > 50000 THEN “High” ELSE “Low” END
- Weekday Extraction: DATENAME(‘weekday’, [Order Date])
Step 4: Building Dashboards
Scenario: Nagpur retail chain wants an executive dashboard:
- Create multiple worksheets:
- Bar chart for revenue by product
- Line chart for weekly revenue trend
- Map showing revenue by region
- KPI cards for total sales and top products
- Combine worksheets into a dashboard
- Add filters and interactive elements
- Adjust layout for executive readability
Table: Tableau Visual Types & Use Cases
| Visual Type | Purpose | Example Use Case |
| Bar Chart | Compare categories | Revenue by product |
| Line Chart | Show trends over time | Weekly sales growth |
| Pie Chart | Show proportion of parts to whole | Market share by region |
| Map | Geo-analysis | Revenue across cities/regions |
| KPI Card | Highlight key metrics | Total Revenue, Top Product |
| Scatter Plot | Show correlation between variables | Discount vs Revenue |
| Dashboard | Combine multiple visuals interactively | Executive report |
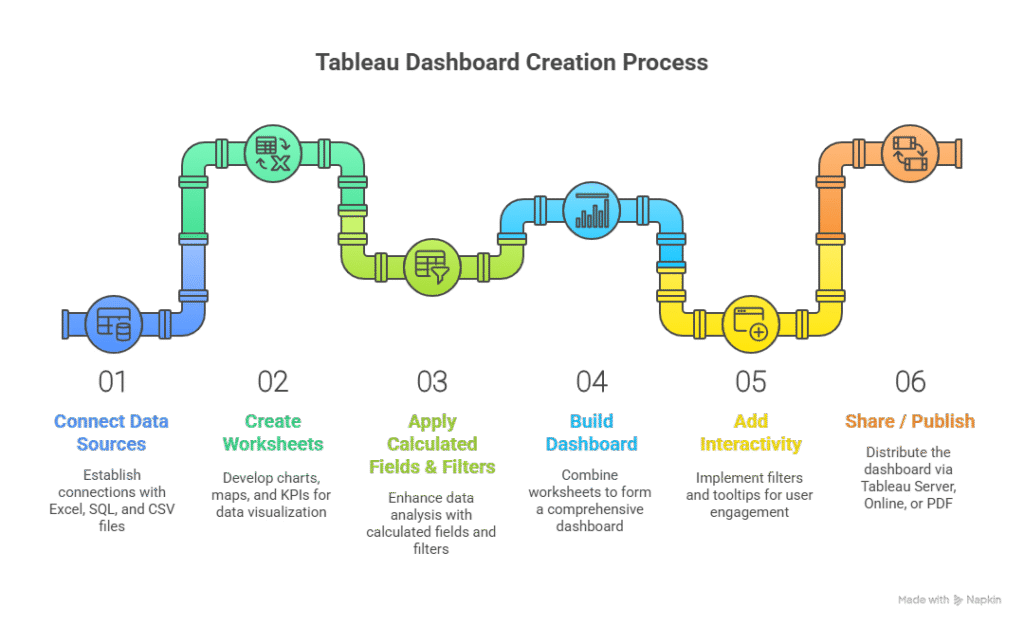
Step 5: Workflow for Tableau Reporting (Textual Flowchart)
Step 6: Real-World Example
Scenario: Analyze festive season sales in Nagpur:
- Connect sales data to Tableau
- Create a bar chart for revenue by product
- Use line chart to show weekly trends
- Map visualization for revenue across cities
- Dashboard combining charts with KPI cards and filters
Outcome: Executives quickly identify:
- Top-performing products
- Revenue trends across regions
- Opportunities for marketing campaigns
At curiositytech.in learners practice these exercises and publish dashboards, building skills for real corporate reporting in 2025.
Common Mistakes in Tableau
- Overcrowding dashboards → reduces clarity
- Ignoring filters → less interactive insights
- Using too many colors → visual confusion
- Not updating data sources → outdated reports
- Skipping calculated fields → missing dynamic metrics
Tips to Master Tableau
- Start with small datasets, gradually move to complex projects
- Learn to combine multiple worksheets into a single dashboard
- Explore calculated fields and parameters for advanced insights
- Practice storytelling: charts should communicate a business message
- At CuriosityTech.in, our Tableau workshops teach learners to turn raw sales and customer data into executive-ready dashboards, with mentorship for reporting best practices
Infographic Description: “Tableau Executive Dashboard Pipeline”
Visualize as a step-by-step workflow with arrows, highlighting the transformation from raw data to executive-ready insights.

Conclusion
Tableau allows analysts to create compelling, interactive reports that simplify complex datasets for decision-makers. By mastering Tableau, you can turn raw numbers into actionable business stories.
At curiositytech.in, learners in Nagpur practice hands-on Tableau exercises, building dashboards for real business scenarios, applying calculated fields, filters, and interactive elements. Contact us via +91-9860555369 or contact@curiositytech.in to start mastering Tableau dashboards.