Introduction (Storytelling Style)
Imagine three professionals sitting in a boardroom in Nagpur.
- One is pulling up Excel sheets and SQL queries.
- Another is talking about machine learning models and Python notebooks.
- The third is discussing revenue growth, customer satisfaction, and how the CEO should decide the next product launch.
They are all working with data, but their roles are not the same. These are the Data Analyst, Data Scientist, and Business Analyst—three titles that often confuse beginners in 2025.
At CuriosityTech , I often get this question from fresh graduates and professionals switching careers:
“Should I become a data analyst, data scientist, or business analyst? Which one is right for me?”
Let’s break it down deeply, role by role.
Role Breakdown
1. Data Analyst
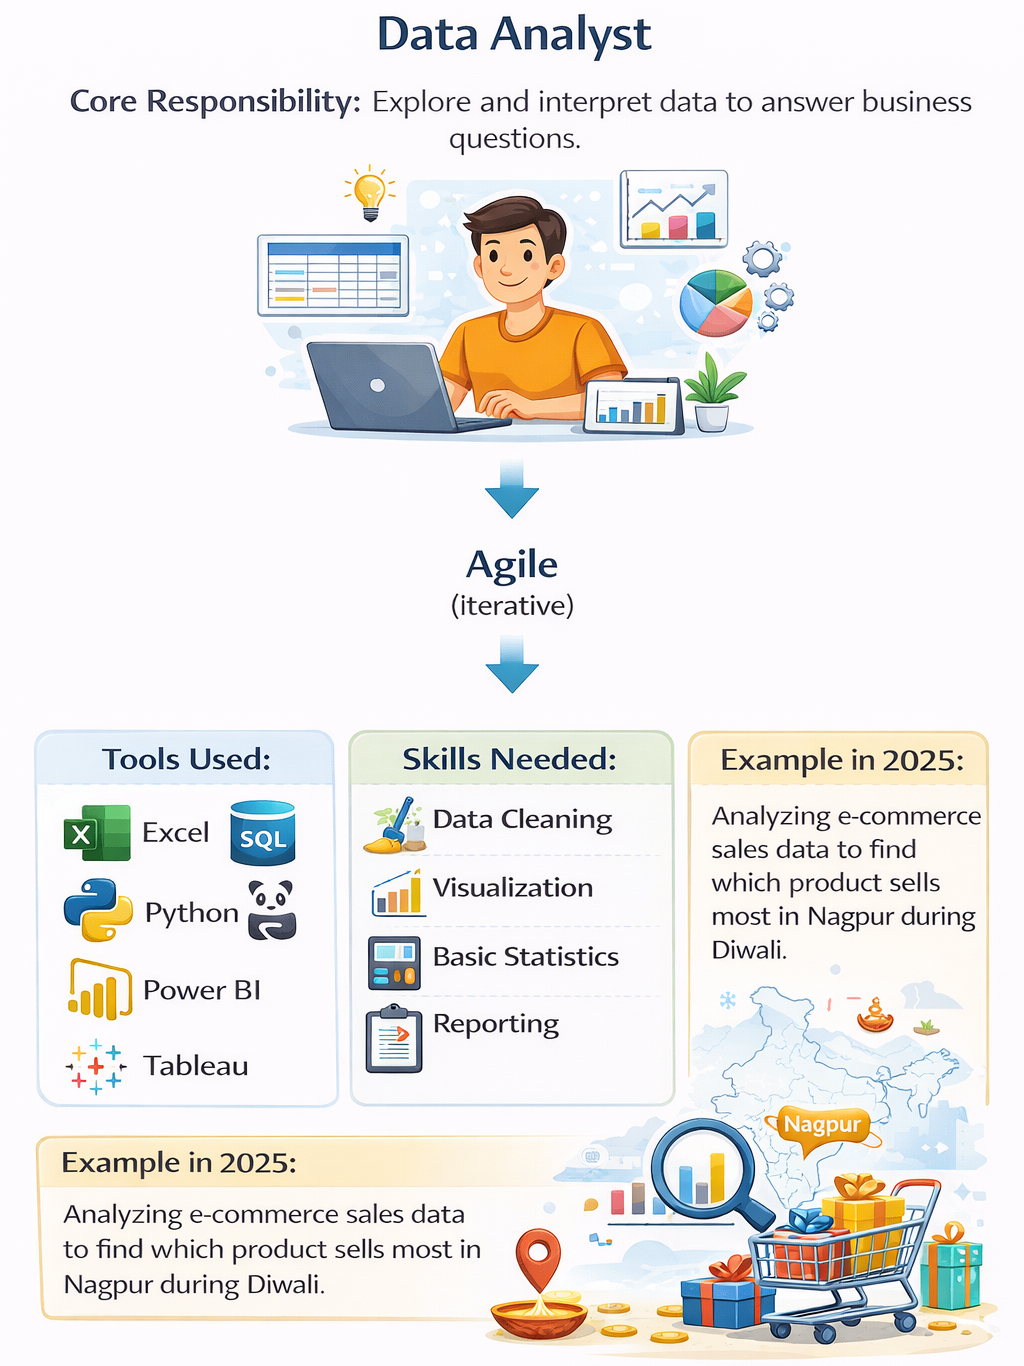
- Core Responsibility: Explore and interpret data to answer business questions.
- Tools Used: Excel, SQL, Python (Pandas), Power BI, Tableau.
- Skills Needed: Data cleaning, visualization, basic statistics, reporting.
- Example in 2025: Analyzing e-commerce sales data to find which product sells most in Nagpur during Diwali.
2. Data Scientist
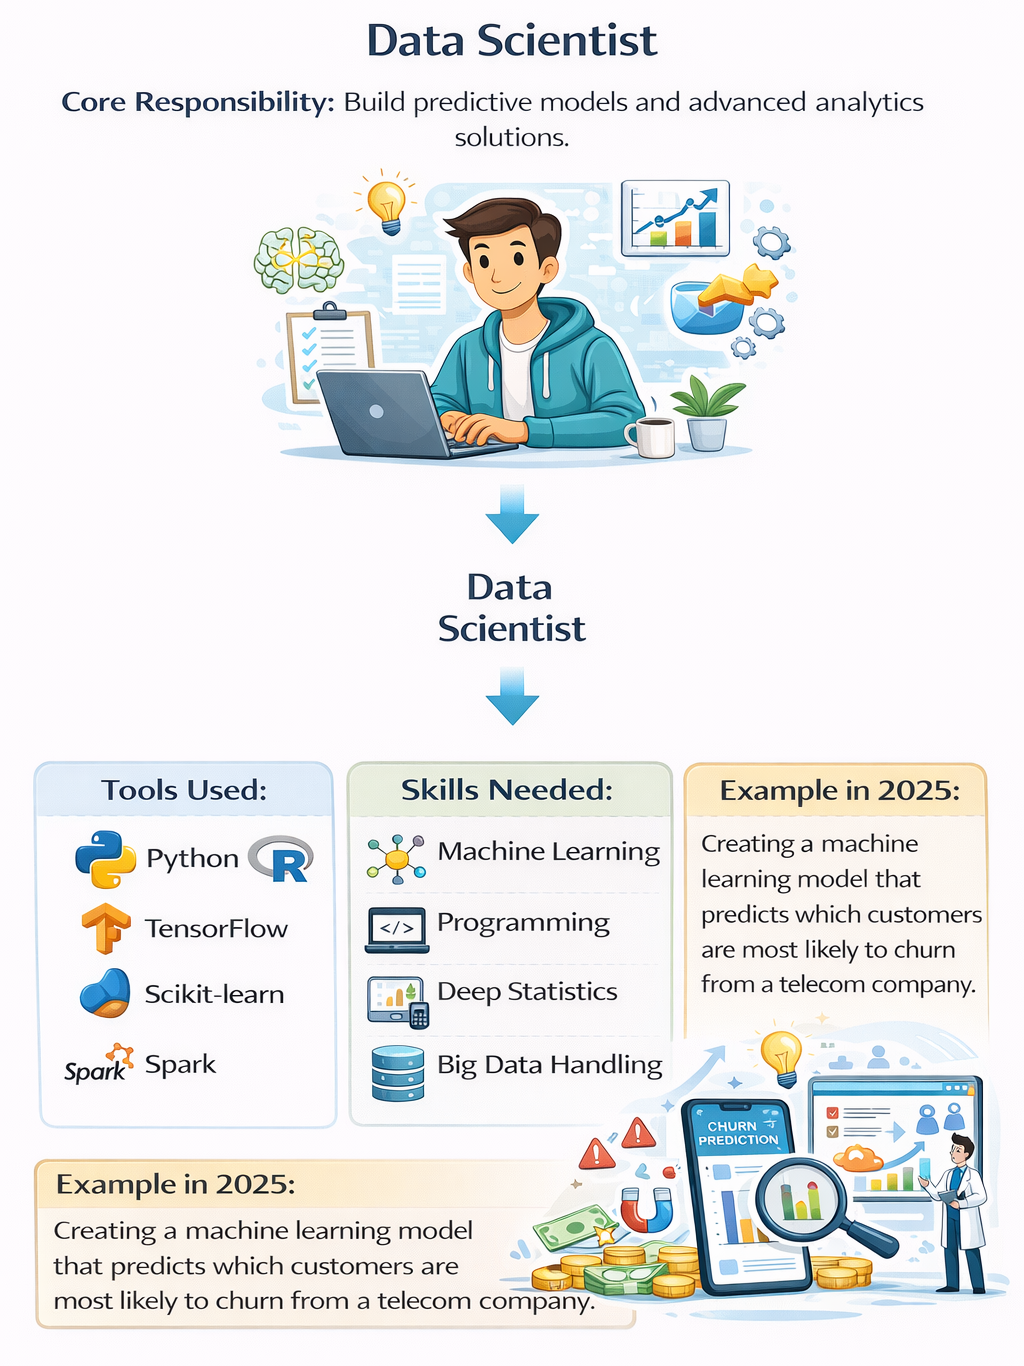
- Core Responsibility: Build predictive models and advanced analytics solutions.
- Tools Used: Python, R, TensorFlow, Scikit-learn, Spark.
- Skills Needed: Machine learning, programming, deep statistics, big data handling.
- Example in 2025: Creating a machine learning model that predicts which customers are most likely to churn from a telecom company.
3. Business Analyst
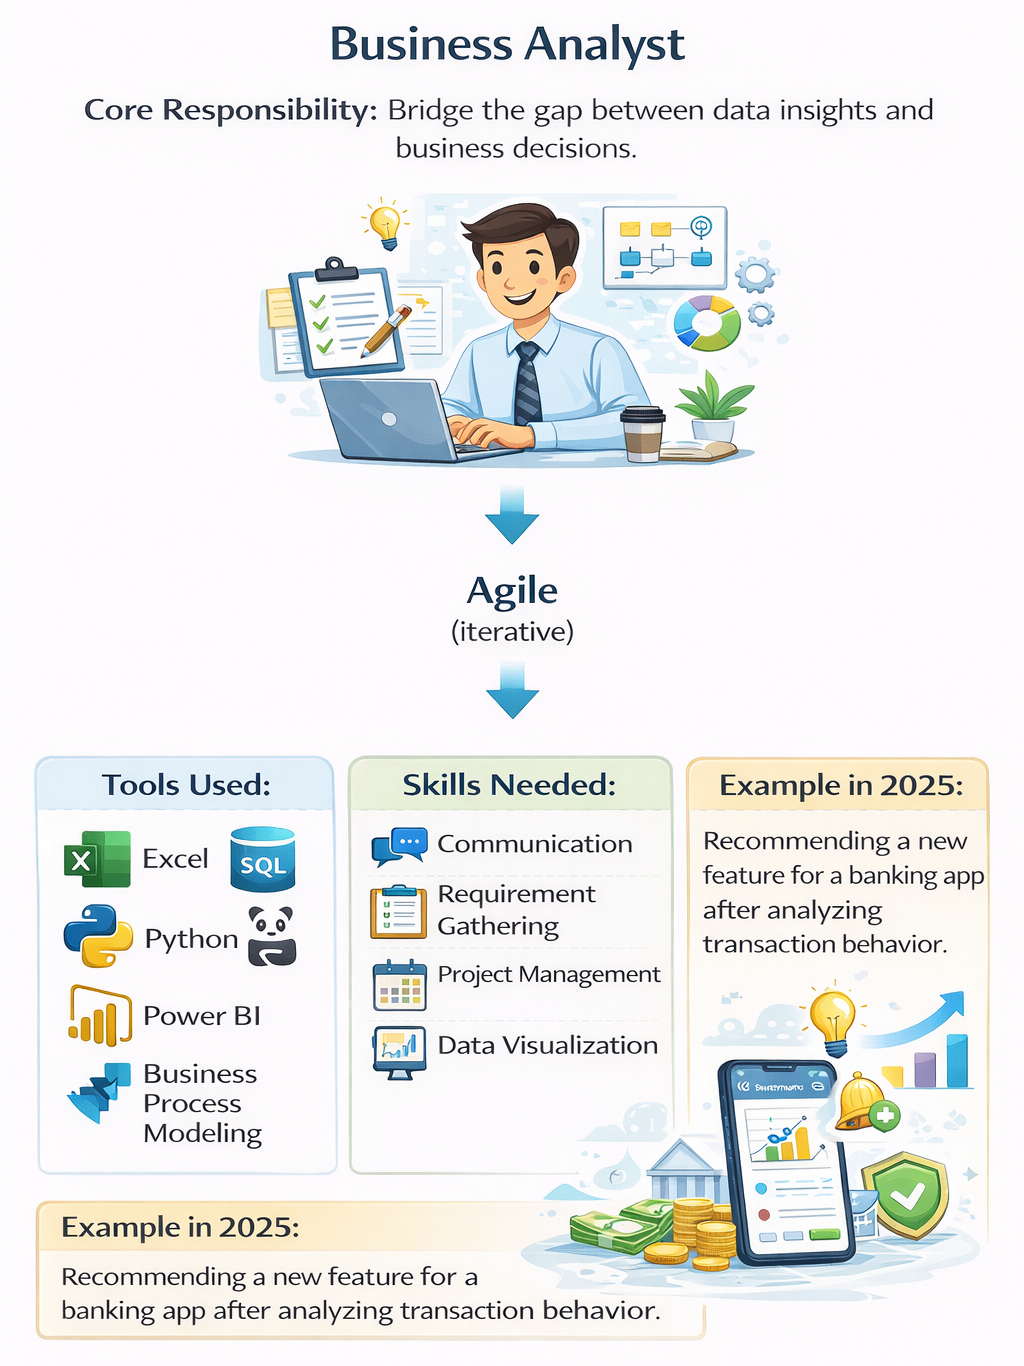
- Core Responsibility: Bridge the gap between data insights and business decisions.
- Tools Used: Excel, SQL, Power BI, Jira, Business process modeling.
- Skills Needed: Communication, requirement gathering, project management, data visualization.
- Example in 2025: Recommending a new feature for a banking app after analyzing transaction behavior.
Key Differences (Comparison Table)
| Feature/Aspect | Data Analyst | Data Scientist | Business Analyst |
| Focus | Past & Present trends | Predictions & AI Models | Business decisions & strategy |
| Tools | Excel, SQL, Power BI, Tableau | Python, R, ML frameworks | Excel, SQL, Power BI, Jira |
| Math/Stats Level | Medium (descriptive stats) | High (ML, probability, regression) | Low-Medium (basic stats, KPIs) |
| Programming | Limited (SQL, some Python) | Strong (Python, R, big data tools) | Minimal |
| Audience | Analysts, team managers | Data teams, technical teams | Executives, stakeholders |
| Salary (India 2025) | ₹6–12 LPA | ₹12–25 LPA | ₹7–14 LPA |
| Growth Path | Senior Analyst → BI Specialist | Senior Data Scientist → AI Architect | Business Consultant → Product Manager |
Venn Diagram (Textual Description)
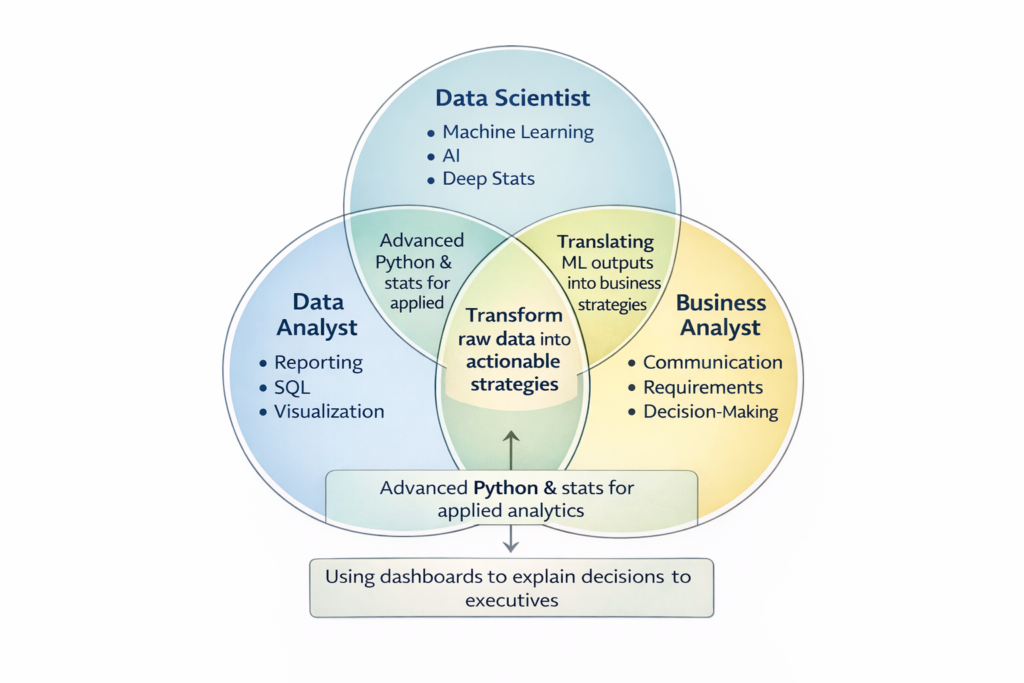
- Circle A – Data Analyst: Reporting, SQL, Visualization.
- Circle B – Data Scientist: Machine Learning, AI, Deep Statistics.
- Circle C – Business Analyst: Communication, Requirements, Decision-Making.
- Data Analyst + Data Scientist: Advanced Python & stats for applied analytics.
- Data Scientist + Business Analyst: Translating ML outputs into business strategies.
- Business Analyst + Data Analyst: Using dashboards to explain decisions to executives.
- All Three Together: The ability to transform raw data into actionable strategies.
Choosing the Right Career Path (Abstraction as Flowchart Steps)
- Do you enjoy working with numbers and patterns?
Ans :- Start with Data Analyst. - Do you love coding, statistics, and AI?
Ans :- Go for Data Scientist. - Do you prefer communication, strategy, and business problem-solving?
Ans :- Opt for Business Analyst.
At CuriosityTech Park (Nagpur), our career roadmap sessions often begin with these simple questions. Many learners reach us through Instagram (CuriosityTech Park) or LinkedIn (Curiosity Tech), asking for guidance. The team personally helps match their skills, interests, and career goals with the right track.
Real-Life Example (Case Study Style)
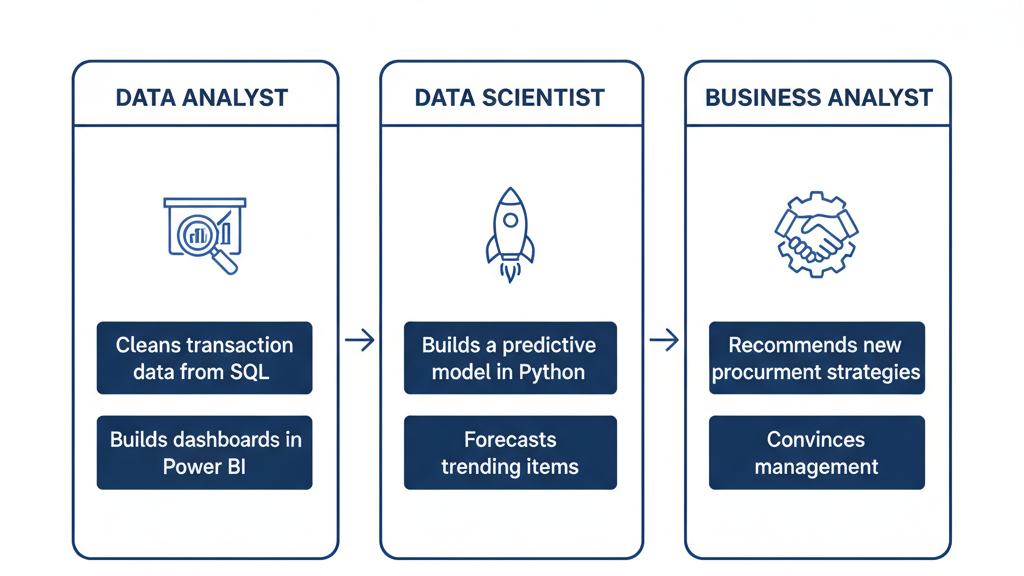
- A Retail Chain in India hires three professionals for the same project:
- Data Analyst: Cleans transaction data from SQL, builds dashboards in Power BI showing best-selling products.
- Data Scientist: Builds a predictive model in Python that forecasts which items will trend next festive season.
- Business Analyst: Uses these insights to recommend new procurement strategies and convinces management to stock higher-demand items.
- Together, they drive a 20% increase in sales within 6 months.
How to Transition Between Roles
- From Data Analyst → Data Scientist: Learn Python deeply, focus on machine learning, and explore big data.
- From Data Analyst → Business Analyst: Strengthen communication, business knowledge, and stakeholder management.
- From Business Analyst → Data Scientist: More difficult, requires building strong technical foundations first.
Infographic (Textual Description)
Title: “3 Faces of Data Careers in 2025”
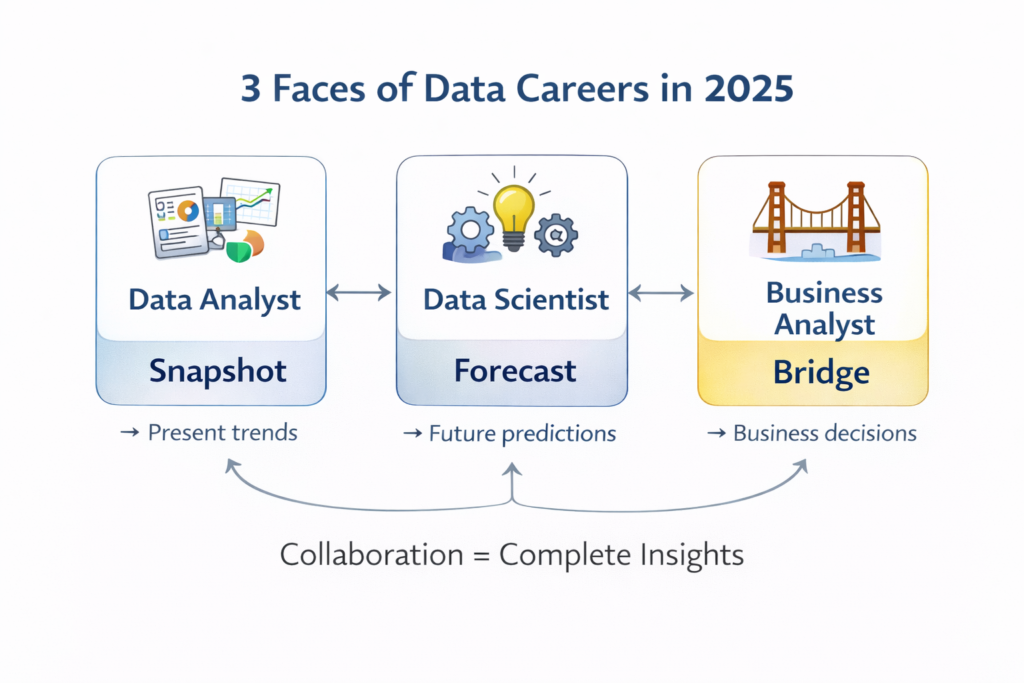
- Left Section: Data Analyst (Snapshot → Present trends)
- Middle Section: Data Scientist (Forecast → Future predictions)
- Right Section: Business Analyst (Bridge → Business decisions)
Lines connecting them with labels: “Collaboration = Complete Insights.”
Conclusion
Choosing between Data Analyst, Data Scientist, and Business Analyst is not about which job is “better,” but which job fits your strengths and career goals. In 2025, all three roles are in high demand—and often work hand in hand.
At CuriosityTech.in, we encourage learners to first explore data analytics basics (Excel, SQL, Python) before making a final decision. With workshops in Nagpur (Plot No 81, Wardha Rd, Gajanan Nagar), online mentorship, and social learning via LinkedIn and Facebook (Curiosity Tech), you can confidently build your path.
If you’re unsure where to start, just drop us an email at contact@curiositytech.in or call +91-9860555369—we help you navigate the confusion with real-world advice.