

Introduction
Landing a data analyst role in 2025 requires more than technical skills. Employers seek problem-solving abilities, analytical thinking, and practical application of tools.
Imagine a Nagpur professional applying for a data analyst role in a multinational company. Without structured preparation, even strong technical skills can be overshadowed by poorly articulated answers or lack of practical examples.
At CuriosityTech.in, learners are guided to practice real-world interview scenarios, covering SQL, Excel, Python, Power BI, Tableau, and business analytics questions to maximize their chances of success.
Step 1: Technical Questions
SQL Questions:
1. What is a JOIN? Explain different type ?
Answer : A JOIN combines data from two or more tables based on a related column. Types include
- INNER JOIN: Returns matching records only.
- LEFT JOIN: Returns all records from left table + matching records from right
- RIGHT JOIN: Returns all records from right table + matching from left
- FULL OUTER JOIN: Returns all records from both tables
2. How do you find duplicate records in SQL ?
Answer: Use GROUP BY and HAVING COUNT(*) > 1 or window functions with ROW_NUMBER().
3. Explain CTEs and why they are used ?
Answer: Common Table Expressions (CTEs) break complex queries into readable, reusable blocks, improving query clarity and maintainability.
Excel Questions:
1. How do you handle missing values in Excel?
Answer :
- Use IFERROR() to replace errors.
- Filter and remove blank rows
- Use AVERAGEIF() or IFNA() to handle incomplete data
2. Explain the difference between VLOOKUP and INDEX-MATCH ?
Answer : VLOOKUP searches a column, while INDEX-MATCH allows flexible row/column lookups and handles multiple criteria, offering better performance on large datasets.
Python / Data Analysis Questions:
1 . How do you handle missing data in Pandas?
Answer:
- df.dropna() to remove missing rows
- df.fillna(value) to impute missing values
- Analyze the impact before choosing the method
2. How do you merge two DataFrames in Pandas?
Answer : Use pd.merge(df1, df2, on=’key’, how=’inner/left/right/outer’) depending on join requirement.
BI Tools Questions (Power BI / Tableau):
1. How do you create an interactive dashboard in Power BI?
Answer:
- Connect data sources
- Create visuals: charts, KPIs, slicers
- Apply filters and interactions
- Publish to Power BI service for sharing
2. Difference between Tableau Desktop and Tableau Server ?
Answer : Desktop is for creating dashboards; Server is for sharing, collaboration, and scheduling refreshes.
Step 2: Analytical Thinking Question
1 . How would you identify trends in a dataset?
Answer:
- Conduct EDA: descriptive statistics, pivot tables
- Visualize data using line charts, scatter plots
- Check seasonality, outliers, correlations
2 . A dataset has sales for multiple regions. How do you find underperforming regions?
Answer:
- Aggregate sales by region
- Compare against historical benchmarks
- Use visualizations to highlight trends
Step 3: Scenario-Based / Behavioral Questions
1 . Describe a situation where you corrected a critical data error ?
Answer:
- Explain the error (e.g., duplicate records, missing data)
- Steps taken: SQL cleaning, Excel corrections, validation
- Outcome: Improved report accuracy and informed decisions
2 . Question: How do you prioritize tasks when multiple reports are due ?
Answer:
- Assess business impact of each report
- Use automation tools to streamline recurring tasks
- Communicate timelines to stakeholders
Step 4: Table – Interview Questions Summary
| Category | Example Questions | Difficulty | Preparation Resources |
| SQL | JOINs, CTEs, duplicate handling | Medium | LeetCode SQL, W3Schools, CuriosityTech.in workshops |
| Excel | VLOOKUP vs INDEX-MATCH, missing values | Medium | Microsoft Learn, CuriosityTech.in Excel labs |
| Python / Pandas | Data cleaning, merge, groupby | Medium | DataCamp, Coursera, CuriosityTech.in Python labs |
| BI Tools | Power BI dashboards, Tableau features | Medium | Power BI Docs, Tableau Community, CuriosityTech.in practical sessions |
| Analytical Thinking | Trends, outliers, business insights | Medium | Kaggle datasets, case studies, CuriosityTech.in projects |
| Behavioral / Scenario | Problem-solving, prioritization | Easy-Medium | STAR method practice, mentorship at CuriosityTech.in |
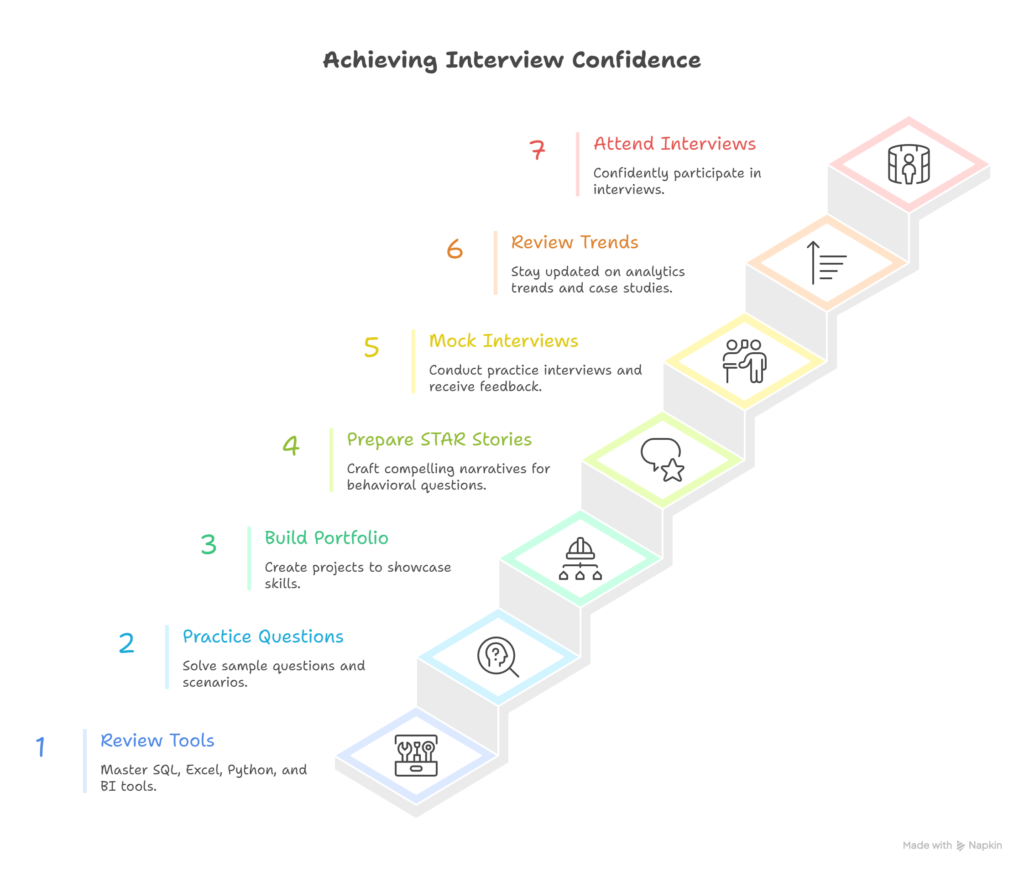
Step 5: Interview Preparation Workflow
Step 6: Tips to Impress Interviewers
- Always quantify your results: e.g., “Reduced report generation time by 50% using SQL optimization.”
- Highlight portfolio projects and dashboards
- Demonstrate problem-solving and business document
- Showcase knowledge of 2025 tools and trends, e.g., AI-driven BI, real-time dashboards.
- Practice clear and concise communication, especially explaining technical concepts to non-technical stakeholders.
- At CuriosityTech.in, learners receive mock interviews, feedback, and scenario-based training to gain confidence and polish answers.
Conclusion
Preparing for data analyst interviews in 2025 requires technical expertise, analytical thinking, and effective communication. By practicing SQL, Excel, Python, BI tools, and real-world scenarios, candidates can increase their employability and confidence.
At curiositytech.in, learners in Nagpur practice interview questions, build portfolio projects, and receive mentorship, ensuring they are fully prepared for professional data analyst roles. Contact +91-9860555369 or contact@curiositytech.in to start your interview preparation journey for analytics jobs in