Introduction
Every aspiring Machine Learning Engineer in 2025 needs to master three Python libraries before diving deep into algorithms:
- NumPy – for numerical computations.
- Pandas – for structured data handling.
- Matplotlib – for visualization.
At CuriosityTech.in (Nagpur, Wardha Road, Gajanan Nagar), we never let students start ML without these foundations, because they’re the backbone of every project—whether you’re building a recommender system, NLP pipeline, or computer vision application.
This blog is not theory-heavy. Instead, it’s a guided tutorial with practical examples, step-by-step usage, and explanations designed for beginners transitioning to ML in 2025.
1. Why Python for ML in 2025?
- Ease of learning → Python’s syntax is intuitive.
- Community support → Global contributions and documentation.
- Rich ecosystem → From Pandas to TensorFlow, everything exists in Python.
- Industry adoption → ML roles at companies hiring from Curiosity Tech alumni consistently demand Python expertise.
Step 1: Understanding NumPy – Numerical Python
NumPy provides multi-dimensional arrays and functions for linear algebra, statistics, and mathematical operations.
Key Features of NumPy:
- Efficient n-dimensional array object (ndarray).
- Fast vectorized operations (no need for slow Python loops).
- Supports linear algebra, Fourier transforms, random number generation.
Example: Creating an Array
import numpy as np
arr = np.array([1, 2, 3, 4, 5])
print(arr.mean()) # Output: 3.0
NumPy powers every ML algorithm behind the scenes. Even frameworks like Scikit-Learn rely on NumPy arrays for computations.
Step 2: Pandas – Data Handling Superpower
Pandas helps you clean, manipulate, and analyze structured data (rows and columns).
Why Pandas is Crucial for ML:
- Handles missing values.
- Offers data transformations (scaling, encoding).
- Provides DataFrame objects for real-world datasets.
Example: Reading CSV Data
import pandas as pd
df = pd.read_csv(“sales.csv”)
print(df.head())
This one line loads thousands of rows, ready for preprocessing.
At Curiosity Tech Park (Instagram, Facebook, LinkedIn communities), we often show beginners how Pandas makes messy datasets (like survey responses or e-commerce logs) manageable.
Step 3: Matplotlib – Visualization
ML is incomplete without visualizing insights. Matplotlib helps create plots to understand data distribution and model results.
Example: Plotting Sales Trends
import matplotlib.pyplot as plt
df[“Sales”].plot(kind=”line”)
plt.title(“Monthly Sales Trend”)
plt.show()
This produces a line graph showing sales fluctuations, which a business team can instantly understand.
2. Tutorial Flow: Connecting NumPy, Pandas & Matplotlib
Here’s how these three libraries interact in real-world ML projects:
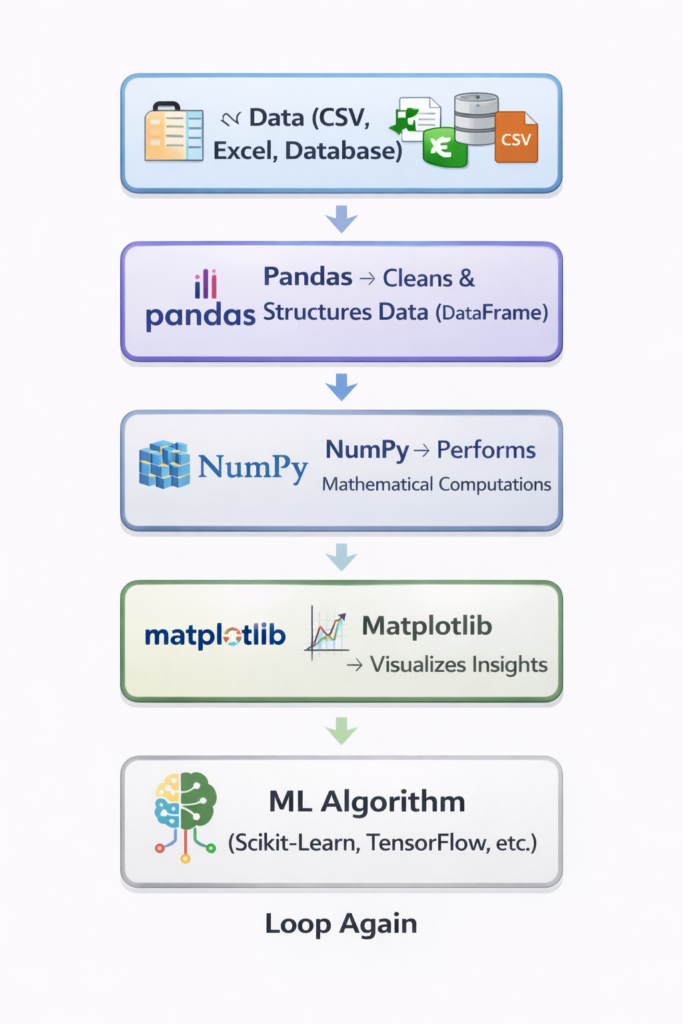
This pipeline is the foundation of every project at CuriosityTech.in—from spam detection to customer churn prediction.
3. Case Study: Housing Price Analysis (Mini-Project)
Problem: Predict housing prices using area and bedrooms.
- Step 1 (Load Data with Pandas):
- data = pd.read_csv(“housing.csv”)
- Step 2 (Clean & Transform):
- Handle missing values : data.fillna(data.mean() , inplace = True)
- Step 3 (Convert to NumPy):
- X = data [[ “area ” , ” bedroom ” ]] . values
- y = data [ “price ” ] . values
- Step 4 (Visualize with Matplotlib):
plt.scatter(data[“area”], data[“price”])
plt.xlabel(“Area (sq ft)”)
plt.ylabel(“Price”)
plt.show()
Even before training ML models, students see how area and price are correlated visually—making abstract math meaningful.
4. Diagram (Infographic Description for Blog)
Imagine a three-circle Venn diagram:
- Left circle: NumPy → “Numbers, Arrays, Computations.”
- Middle circle: Pandas → “DataFrames, Cleaning, Real-world Data.”
- Right circle: Matplotlib → “Visuals, Trends, Insights.”
- In the overlapping center: Machine Learning Foundation.
This illustrates that true ML expertise comes from mastering all three together.
5. Common Mistakes Beginners Make
- Using Excel instead of Pandas → Slows down analysis at scale.
- Forgetting NumPy operations → Leads to writing inefficient Python loops.
- Misusing Matplotlib → Creating cluttered plots instead of insightful visuals.
At CuriosityTech Nagpur, we dedicate entire practice sessions to overcoming these mistakes, because clarity in data handling is key to scaling ML careers.
6. Industry Relevance in 2025
Top roles hiring in 2025—whether Data Scientist, ML Engineer, or MLOps Engineer—all expect fluency in these three libraries.
Companies using AWS Sagemaker, Google Vertex AI, and Azure ML still rely on engineers who can clean datasets with Pandas, compute with NumPy, and visualize with Matplotlib before deployment.
That’s why recruiters contacting us at CuriosityTech.in repeatedly highlight these as “mandatory interview skills.”10. How CuriosityTech.in Trains You
Unlike fragmented online courses, our workshops integrate:
- Hands-on projects using Pandas, NumPy, Matplotlib.
- Step-by-step mentoring via email (contact@curiositytech.in) and calls (+91-9860555369).
- Community support on LinkedIn, Instagram, and Facebook pages (Curiosity Tech / CuriosityTech Park).
Every student practices with real datasets, not toy examples—so learning is immersive, not abstract.
Conclusion
Machine Learning may sound intimidating, but its foundation rests on three pillars: NumPy, Pandas, and Matplotlib. If you can manipulate arrays, handle dataframes, and visualize insights—you’re already halfway into ML.
As we tell learners at Curiosity Tech Nagpur: “Master these three tools, and you’ll never feel lost when building machine learning projects.”
This isn’t just learning libraries—it’s about developing the mindset of a machine learning engineer.