

Introduction (Practical Workbook Style)
Excel remains the foundation of data analysis in 2025, even with advanced tools like Power BI and Tableau. From small startups in Nagpur to large corporations, Excel is the first tool every analyst learns.
At curiositytech.in, our students often say:
“We understand advanced Python or SQL, but without mastering Excel, our analysis feels incomplete.”
This is why mastering pivot tables, charts, and functions is critical.
Step 1: Pivot Tables – Summarize Data Efficiently
Purpose: Quickly aggregate and analyze large datasets without complex formulas.
Example: You have a retail sales dataset:
- Columns: Date, Product, Region, Sales
- Task: Analyze total sales by product and region
Steps:
- Select dataset → Insert → Pivot Table
- Drag Product to Rows
- Drag Region to Columns
- Drag Sales to Values → Sum
- Add filters for Date or Region
Result: A table showing total sales for each product across regions, instantly summarizing 50,000+ rows.
Step 2: Charts – Visualize Data Clearly
Excel charts turn raw numbers into insights:
| Chart Type | Best For | Example Use Case |
| Column Chart | Compare categories | Sales by product |
| Line Chart | Show trends over time | Monthly revenue growth |
| Pie Chart | Show proportion of parts to whole | Market share by region |
| Combo Chart | Mix of bar & line | Revenue vs Target |
| Scatter Plot | Show correlation between variables | Marketing spend vs Sales |
Tip: Always label axes, add a legend, and avoid excessive colors.
Step 3: Essential Functions
1. SUM() – Add numbers
=SUM(B2:B100)
2. AVERAGE() – Mean value
=AVERAGE(C2:C100)
3. COUNT()/COUNTA() – Count entries
4. IF() – Conditional analysis
=IF(D2>5000, “High”, “Low”)
5. VLOOKUP()/XLOOKUP() – Combine data from tables
=XLOOKUP(ProductID, Products[ID], Products[Name])
6. CONCAT()/TEXTJOIN() – Merge text
7. DATE()/YEAR()/MONTH() – Handle dates efficiently
Table: Function Purpose & Example
| Function | Purpose | Example Output |
| SUM() | Total of numbers | ₹50,000 |
| AVERAGE() | Mean value | ₹5,000 |
| IF() | Conditional decision | “High” or “Low” |
| VLOOKUP() | Lookup value in table | Product Name for given ID |
| COUNT()/COUNTA() | Count numbers or entries | 100 customers |
| CONCAT()/TEXTJOIN() | Merge multiple text strings | “Nagpur – Product A” |
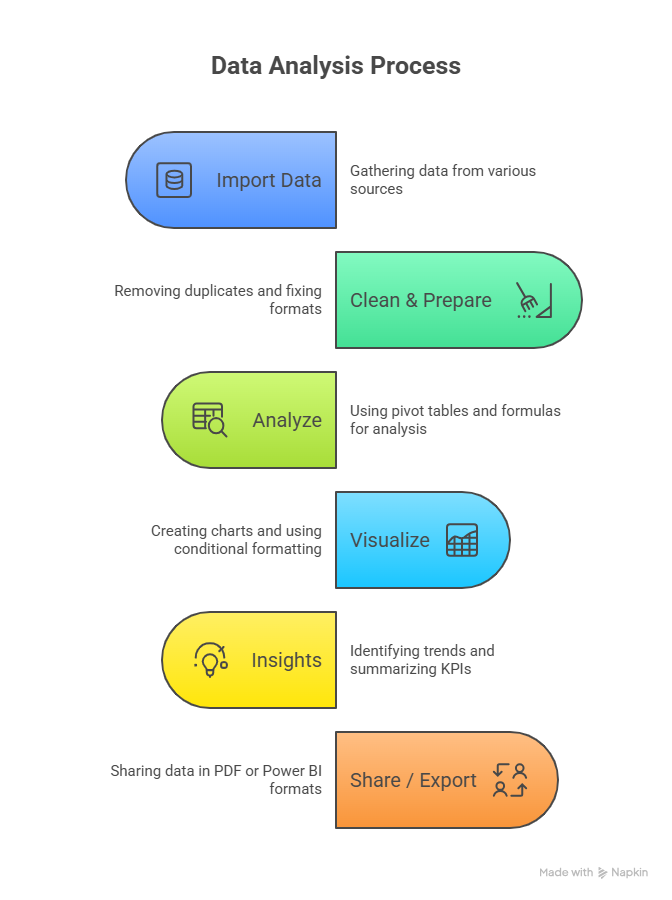
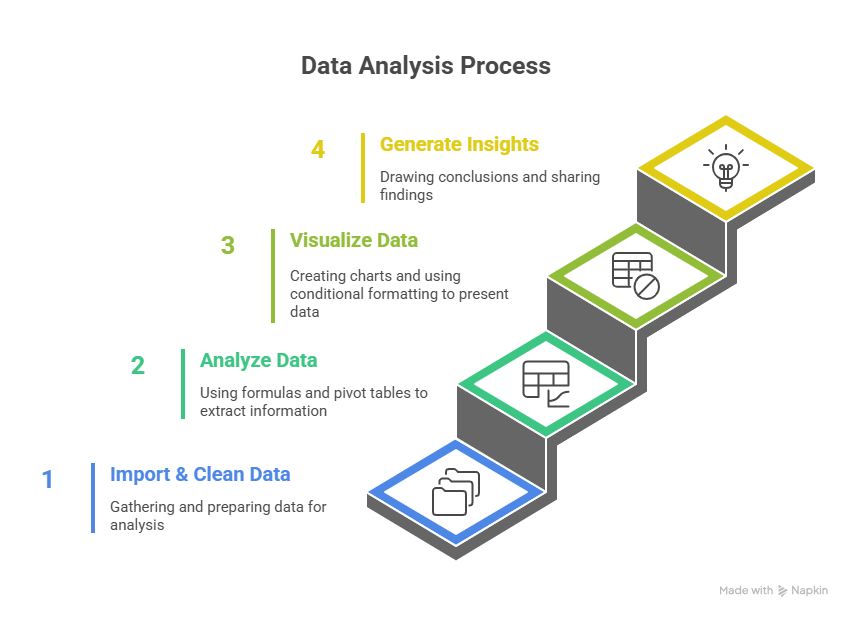
Excel Workflow for Analysis (Flowchart – Textual Description)
Real-World Scenario (Practice Lab)
A retail store in Nagpur wants to analyze last quarter’s sales:
- Raw Data: 10,000+ orders, products, regions, quantities.
- Pivot Table: Sum of sales by Product and Region.
- Charts: Column chart for top-selling products; line chart for revenue trends.
- Functions: IF() to classify products as “High Seller” or “Low Seller,” VLOOKUP() to fetch product categories.
Outcome: Management can instantly see which products drive revenue, and marketing can focus on lagging items.
Common Mistakes to Avoid
- Using manual summing instead of SUM() → prone to errors.
- Pivot tables not refreshed → outdated insights.
- Overcrowded charts → difficult to read.
- Hardcoded numbers → non-reusable reports.
- Ignoring date formats → incorrect trend analysis.
Tips to Master Excel for Data Analysis
- Start with formulas and functions, then move to pivot tables.
- Learn keyboard shortcuts to speed up analysis.
- Use conditional formatting to highlight patterns automatically.
- Practice real-world datasets (sales, finance, HR) like we provide at CuriosityTech.in workshops.
- Connect Excel to SQL and Power BI to handle larger datasets efficiently.
Our learners in Nagpur regularly practice full analysis projects in Excel, then present dashboards, charts, and insights. Many participants share their work on LinkedIn (Curiosity Tech), demonstrating applied Excel skills to recruiters.
Infographic Description: “Excel Analysis Pipeline”
Conclusion
Excel remains the bedrock of data analysis, offering a blend of simplicity and power. Pivot tables, charts, and functions allow analysts to transform raw datasets into actionable insights efficiently.
At curiositytech.in, our hands-on Excel workshops in Nagpur equip learners to handle real business challenges, preparing them for advanced tools like SQL, Python, and Power BI. Contact us via +91-9860555369 or contact@curiositytech.in to start your practical journey.

