
Introduction (Visual Storytelling)
In 2025, data without visualization is like a story without illustrations. Decision-makers rarely read tables of numbers—they respond to visual insights.
Imagine a retail company in Nagpur: 50,000 transaction rows. A raw table of sales numbers won’t help the CEO spot trends. But a line chart showing sales growth, or a bar chart comparing products, communicates insights instantly.
At CuriosityTech.in, we train learners to use Python’s Matplotlib & Seaborn libraries to craft business-ready visuals.
Step 1:- Setup Python Visualization Environment
- Install libraries:
!pip install matplotlib seaborn
- Import libraries:
import matplotlib.pyplot as plt
import seaborn as sns
import pandas as pd
- Load dataset:
data = pd.read_csv(“retail_sales_nagpur.csv”)
Step 2:- Matplotlib Essentials
- Line Chart: Show trends over time
plt.figure(figsize=(10,5))
plt.plot(data[‘Date’], data[‘Revenue’])
plt.title(‘Revenue Trend’)
plt.xlabel(‘Date’)
plt.ylabel(‘Revenue’)
plt.show()
- Bar Chart: Compare categories
plt.bar(data[‘Product’], data[‘Revenue’])
plt.title(‘Revenue by Product’)
plt.xticks(rotation=45)
plt.show()
- Scatter Plot: Identify relationships
plt.scatter(data[‘Quantity’], data[‘Revenue’])
plt.title(‘Quantity vs Revenue’)
plt.xlabel(‘Quantity’)
plt.ylabel(‘Revenue’)
plt.show()
Step 3:- Seaborn Essentials
Seaborn adds statistical plots with aesthetics:
- Histogram: Distribution of revenue
sns.histplot(data[‘Revenue’], bins=20, kde=True)
plt.show()
- Boxplot: Detect outliers
sns.boxplot(x=’Product’, y=’Revenue’, data=data)
plt.show()
- Heatmap: Correlation matrix
corr = data.corr()
sns.heatmap(corr, annot=True, cmap=’coolwarm’)
plt.show()
- Barplot with hue: Compare multiple variables
sns.barplot(x=’Product’, y=’Revenue’, hue=’Region’, data=data)
plt.show()
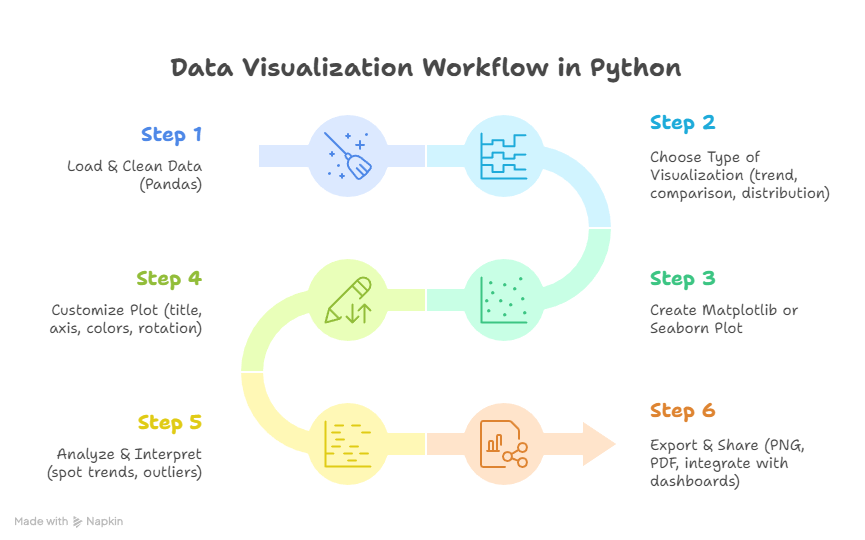
Step 4:- Workflow for Creating Visual Stories (Textual Flowchart)
Step 5: Real-World Scenario
Scenario: Retail company in Nagpur wants insights for festive season sales:
- Load CSV of orders & revenue
- Use line chart to visualize revenue trends by week
- Use barplot with hue to compare revenue by product across regions
- Use boxplot to detect outlier orders and unusual spikes
- Summarize findings in a dashboard for executives
Outcome: Executives instantly spot top-performing products, underperforming regions, and anomalous sales, leading to informed marketing and stocking decisions.
Common Mistakes in Visualization
- Using default colors → Hard to interpret
- Overcrowding charts → Confusing insights
- Ignoring labels/legends → Misleading interpretation
- Failing to clean data first → Charts show incorrect patterns
- Choosing wrong chart type → Trends may not be communicated effectively
Tips to Master Data Visualization
- Start simple: Matplotlib for basic charts, Seaborn for aesthetics
- Explore different chart types and match to business questions
- Customize charts (colors, labels, titles, size) for clarity
- Always clean data before plotting
- Practice on real-world datasets like those used in CuriosityTech.in workshops, e.g., retail, healthcare, finance datasets in Nagpur
- Share your visuals on LinkedIn (Curiosity Tech) to showcase practical skills
Infographic Description: “Visual Analytics Pipeline”
Conclusion
Data visualization is the bridge between raw numbers and business decisions. Using Matplotlib & Seaborn, analysts can turn large datasets into insights that are easily interpretable by stakeholders.
At CuriosityTech.in, our 2025 workshops in Nagpur teach learners to combine Python analysis with visualization, creating dashboards and reports that impress management. For guidance, contact +91-9860555369 or contact@curiositytech.in and start building visual storytelling skills in Python.