

In modern DevOps practices, monitoring and logging are critical to ensure applications are highly available, performant, and secure. Without proper monitoring, detecting performance degradation, failures, or security incidents becomes reactive rather than proactive. Tools like Prometheus, Grafana, and the ELK Stack (Elasticsearch, Logstash, Kibana) have become the industry standard for collecting, visualizing, and analyzing metrics and logs. At Curiosity Tech, we emphasize hands-on mastery of these tools as a cornerstone of DevOps expertise.
Overview of Prometheus, Grafana & ELK Stack
| Tool | Purpose | Key Features | Integration |
| Prometheus | Metrics collection & alerting | Time-series database, multi-dimensional data model, powerful query language (PromQL), alertmanager | Kubernetes, Docker, Linux, Cloud Apps |
| Grafana | Visualization | Interactive dashboards, custom alerts, plug-ins | Prometheus, ELK, MySQL, PostgreSQL, CloudWatch |
| ELK Stack | Log aggregation & analytics | Elasticsearch (storage), Logstash (processing), Kibana (visualization) | Any log-producing system (applications, servers, containers) |
Diagram: Monitoring & Logging Workflow
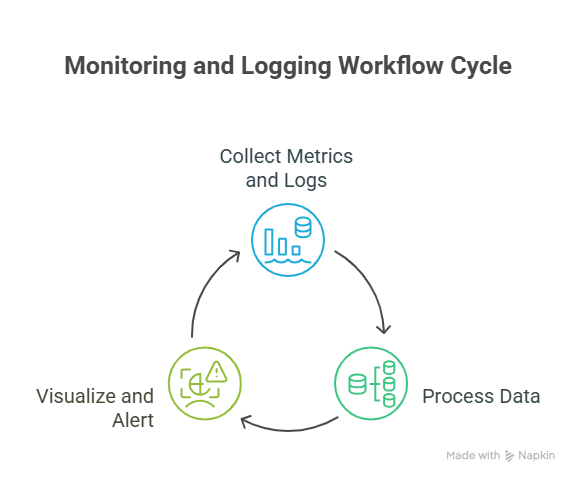
Description: Applications produce metrics and logs, collected by Prometheus and ELK Stack. Grafana visualizes data and triggers alerts, providing real-time insights into system health.
Prometheus: Metrics Collection and Alerting
Prometheus is designed to collect time-series metrics from various sources, such as applications, databases, and servers.
Core Concepts:
- Metric Types: Counter, Gauge, Histogram, Summary
- PromQL: Query language to extract and manipulate metrics
- Alertmanager: Handles alert notifications via email, Slack, etc.
Example PromQL Queries:
- CPU Usage: rate(node_cpu_seconds_total[5m])
- Memory Usage: node_memory_MemAvailable_bytes / node_memory_MemTotal_bytes * 100
Best Practices:
- Define meaningful metrics aligned with SLAs.
- Set up threshold-based alerts for critical events.
- Integrate Prometheus with Grafana for visualization.
Grafana: Visualization and Dashboards
Grafana allows teams to create interactive dashboards to monitor metrics and logs.
Key Features:
- Custom dashboards and panels
- Alerts based on Prometheus metrics
- Multiple data source integrations
- Annotation support for events
Practical Example: Visualize CPU and memory usage of Kubernetes clusters using Prometheus as a data source.
At Curiosity Tech, learners build dashboards for web applications, Kubernetes clusters, and databases, enabling proactive performance monitoring.
ELK Stack: Centralized Logging
The ELK Stack allows collection, processing, and visualization of logs from multiple systems.
Components:
- Elasticsearch – Stores and indexes logs for fast querying.
- Logstash – Processes logs (parsing, filtering, enriching).
- Kibana – Visualizes logs via dashboards and provides search capabilities.
Example Log Pipeline:
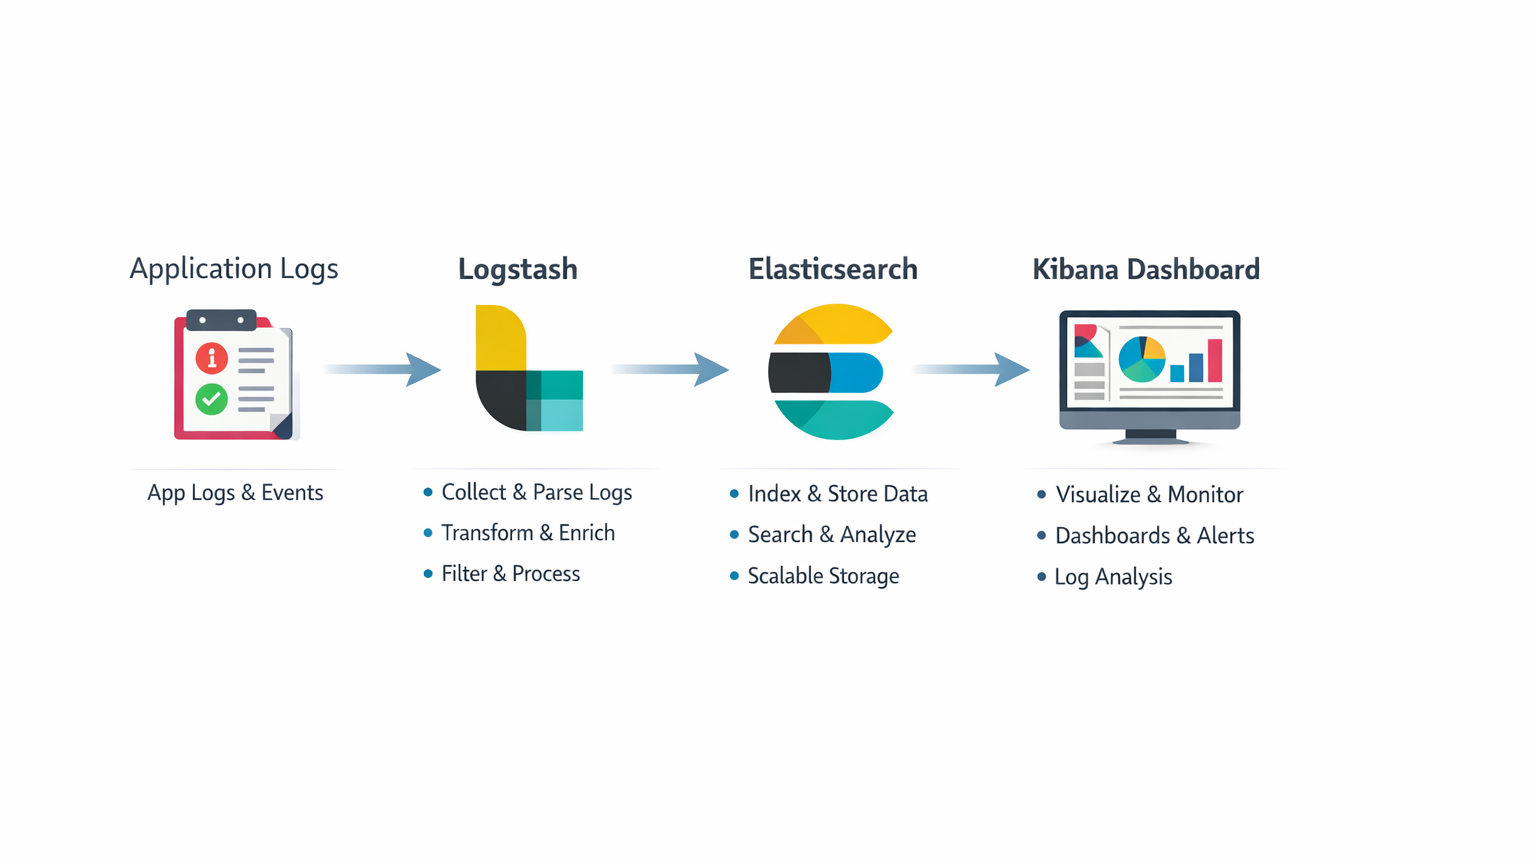
Application Logs → Logstash → Elasticsearch → Kibana Dashboard
Best Practices:
- Centralize logs from all environments (dev, staging, prod).
- Parse and structure logs for easier querying.
- Set up alerts for critical log patterns.
Comparative Table: Prometheus vs ELK Stack
| Feature | Prometheus | ELK Stack |
| Data Type | Metrics (numerical) | Logs (textual) |
| Storage | Time-series DB | Elasticsearch indices |
| Query Language | PromQL | Kibana Query DSL |
| Alerting | Yes (Alertmanager) | Via Kibana or third-party tools |
| Best Use Case | Monitoring resource usage & system metrics | Analyzing application logs and events |
Challenges & Solutions
| Challenge | Solution |
| High Data Volume | Use sharding, retention policies, and aggregation in Elasticsearch |
| Alert Fatigue | Prioritize alerts, use thresholds, and group notifications |
| Complex Dashboards | Start with pre-built templates, then customize |
| Integration Complexity | Use exporters, Beats, and connectors for Prometheus & ELK Stack |
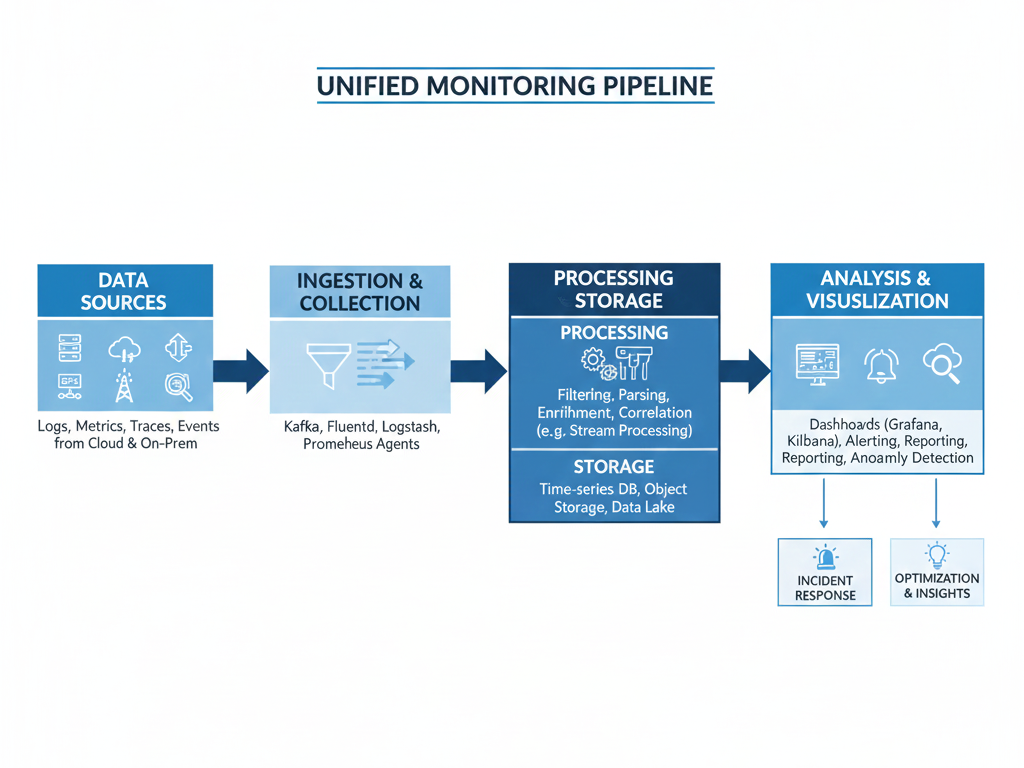
Infographic: Unified Monitoring Pipeline
Conclusion
Monitoring and logging are the pillars of reliable DevOps operations. By leveraging Prometheus, Grafana, and ELK Stack, engineers can proactively detect issues, optimize performance, and maintain compliance. Hands-on practice in setting up pipelines, dashboards, and alerts ensures mastery.
At Curiosity Tech, learners deploy monitoring stacks in cloud and containerized environments, integrate them with CI/CD pipelines, and analyze real-time metrics and logs to become proficient in production-grade observability practices.

