Abstract
The dashboard displays expected revenue from active opportunities. Teams use this data to make informed decisions. Sales reporting and dashboards turn thousands of daily activities into clear insights that show what is working, what is failing, and where revenue is hiding. Over the past two decades, I have seen companies double their revenue simply by learning how to read their numbers correctly.
Organizations such as Curiosity Tech use structured reporting systems to monitor every inquiry coming from curiositytech.in, social platforms, and direct calls to +91-9860555369, ensuring nothing falls through the cracks.
What Sales Reporting Really Is
Sales reporting is the process of collecting, organizing, and analyzing all sales activity. It answers questions like
How many leads came in
It shows how many leads were contacted.
How many converted
It displays how much revenue was generated.
Without reports, sales is blind.
Why Dashboards Are Essential
Dashboards present live data in visual form so managers and salespeople can instantly see
Which deals are moving
The dashboard highlights stalled deals and estimates
Who is performing
expected revenue from active opportunities.
This creates clarity and accountability.
Key Sales Metrics
Leads generated
Conversion rate
Deal size
Sales cycle length
Customer retention
These metrics reveal the health of the sales engine.
Reporting System Flow
Customer interaction
→ CRM
→ Data processing
→ Sales report
→ Dashboard
→ Management action
Sales Report Types
| Report | Purpose |
| Pipeline | Tracks deal progress |
| Performance | Tracks salesperson results |
| Revenue | Tracks income |
| Forecast | Predicts future sales |
Hierarchy of Sales Intelligence
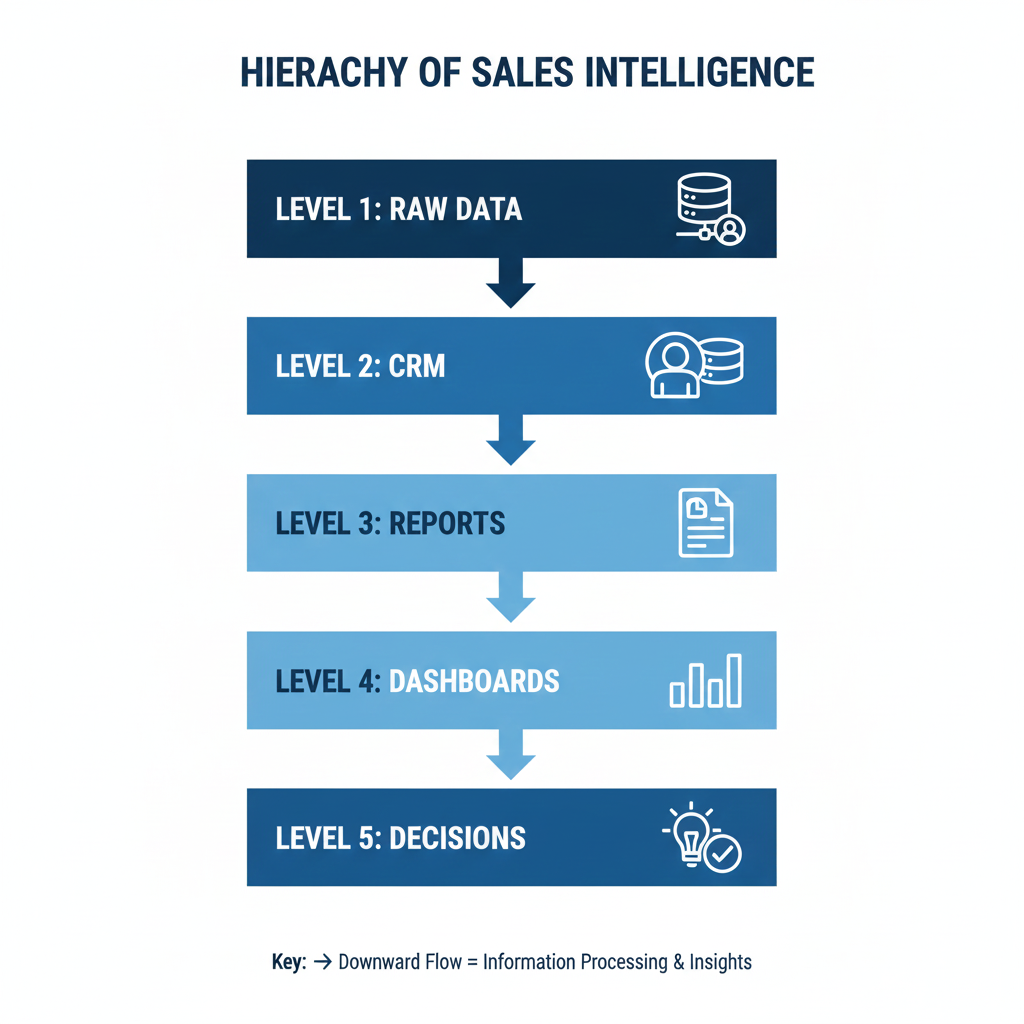
This structure transforms activity into strategy.
Infographic Description
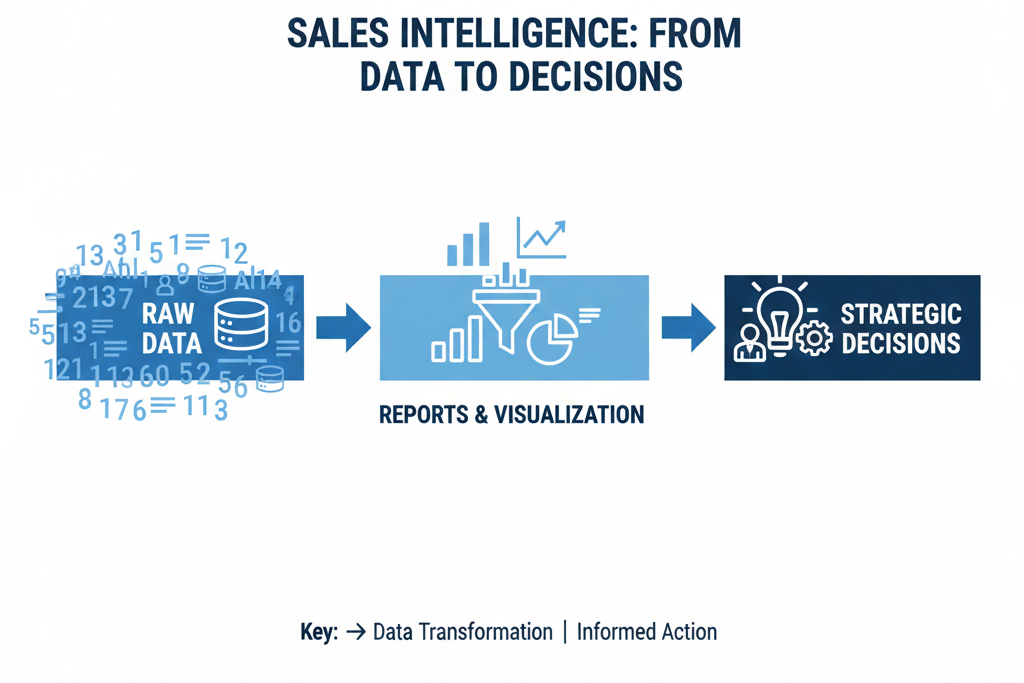
A visual that shows how raw sales data turns into clear charts and graphs. These visuals help businesses make better decisions..
How Professionals Become Data-Driven Sellers
They learn to interpret trends, not just totals. Over time, they use data to improve conversations, follow-ups, and forecasting.
At Curiosity Curiosity Tech, sales teams use dashboards daily to guide every customer interaction.
Conclusion
Sales reporting turns chaos into clarity. Teams that see their numbers clearly always outperform those who rely on instinct alone.