

Introduction
Python is the undisputed lingua franca of Data Science in 2025. From handling massive datasets to building machine learning models, Python’s versatility, simplicity, and rich ecosystem make it the first choice for professionals worldwide.
At CuriosityTech.in (Nagpur, 1st Floor, Plot No 81, Wardha Rd, Gajanan Nagar), we train aspiring data scientists with hands-on Python workflows, so learners can confidently transition from coding basics to real-world projects.
This guide will cover Pandas, NumPy, and Matplotlib—the foundational Python libraries for data manipulation, analysis, and visualization.
NumPy – The Power of Numerical Computation
What is NumPy?
NumPy (Numerical Python) is the core library for numerical computing. It provides multi-dimensional arrays, vectorized operations, and mathematical functions that are far faster than Python lists.
Key Features:
Use Case: Calculating statistical metrics for thousands of customer transactions in milliseconds.
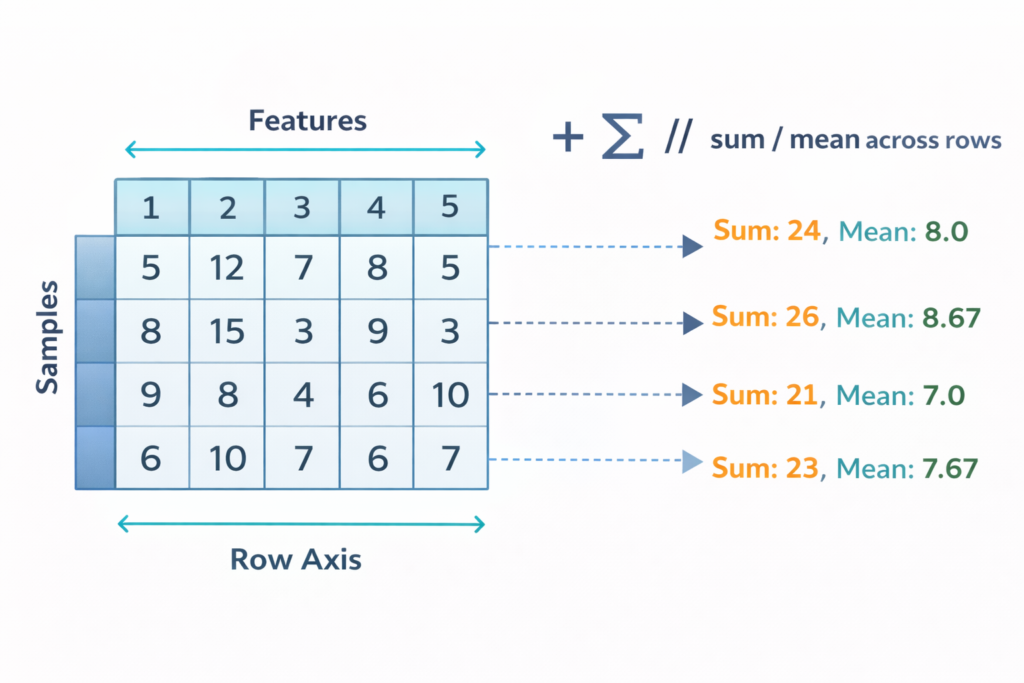
Conceptual Diagram (described):
- Visualize a 2D grid representing a NumPy array.
- Rows = samples, Columns = features.
- Mathematical operations like sum/mean applied simultaneously across all rows.
Pandas – Data Handling Simplified
What is Pandas?
Pandas is Python’s powerhouse for structured data manipulation. It allows you to read, clean, filter, and transform data effortlessly.
Core Data Structures:
- Series – One-dimensional labeled array
- DataFrame – Two-dimensional table (rows and columns)
Common Operations:
- Reading data: pd.read_csv(), pd.read_excel()
- Filtering & indexing: df[df[‘Age’] > 25]
- Handling missing values: df.fillna(), df.dropna()
- Grouping & aggregation: df.groupby(‘Region’)[‘Sales’].sum()
Matplotlib – Bringing Data to Life
What is Matplotlib?
Matplotlib is the primary Python library for static and interactive visualizations. Coupled with Pandas, it helps data scientists tell stories with charts.
Key Visualizations:
- Line plots: trends over time
- Bar charts: categorical comparisons
- Histograms: frequency distributions
- Scatter plots: correlations between variables
Example Conceptual Diagram: Imagine a scatter plot showing Age vs. Annual Income. Observing clusters helps marketers identify high-value customer segments.
4. Step-by-Step Mini Project: Analyzing Employee Data
A) Load Data (Pandas) :-
import pandas as pd
df = pd.read_csv(’employee_data.csv’)
B) Clean Data :-
df.dropna(subset=[‘Salary’], inplace=True)
C) Analyze (NumPy + Pandas) :-
import numpy as np
avg_salary = np.mean(df[‘Salary’]) high_earners = df[df[‘Salary’] > avg_salary]
D) Visualize (Matplolib) :-
import matplotlib.pyplot as plt plt.hist(df[‘Salary’], bins=10) plt.title(‘Salary Distribution’) plt.show()
Outcome: Learners can immediately see which employees are high earners and identify distribution patterns.
Comparative Table: NumPy vs Pandas vs Matplotlib
| Library | Purpose | Core Strength | Example Task |
| NumPy | Numerical computations | Speed, arrays, linear algebra | Calculate mean sales per region |
| Pandas | Data manipulation & analysis | DataFrames, filtering, grouping | Clean customer data & summarize |
| Matplotlib | Visualization | Plotting charts & graphs | Show revenue trends by month |
Best Practices for Python in Data Science
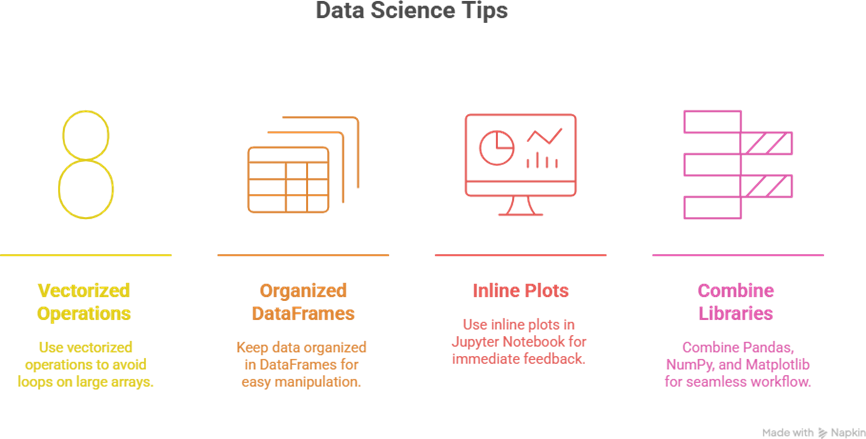
Tip to Become Expert in Python Data Science :-
Conclusion
Python is the cornerstone for data science mastery in 2025. By learning NumPy, Pandas, and Matplotlib, you gain the ability to:
- Process and clean data efficiently
- Perform advanced analyses
- Visualize patterns to make decisions
- Bridge the gap between raw data and actionable insights
At CuriosityTech.in, we focus on hands-on, practical training, mentoring learners to become confident, industry-ready data scientists. For more guidance, reach us at +91- 9860555369, email contact@curiositytech.in, or follow our social channels (LinkedIn: Curiosity Tech, Instagram: CuriosityTech Park).

